
Summarize this blog post with:
Does your client report answer the questions that matter the most to them?
That’s the challenge marketers keep chasing. We talk a lot about tracking KPIs, measuring performance, and automating repetitive tasks. But it all comes down to one thing: giving clients the data they need.
And here’s the catch: data isn’t scarce anymore. It is everywhere.
The real challenge is turning the data into insights clients can understand and act on. That’s exactly what an effective client report is designed to do.
Whether you’re reporting on SEO, PPC, social media or ecommerce performance, a well-structured client report helps stakeholders quickly understand what’s working, what’s not, and where to focus next.
In this guide, you’ll learn three proven ways to create a client report – from using ready-made templates to building reports using AI, so you can deliver accurate insights and help your clients make better decisions.
Let’s get started.
What is Client Reporting?
Client Reporting is how agencies update clients on the progress of their projects and marketing efforts. This information allows your clients to make better decisions and improve outcomes. Regular reports strengthen your agency-client relationship by reinforcing transparency and trust.
A good client report goes beyond presenting metrics. It turns data into insights that help clients make informed decisions and stay aligned with their goals.
For example, a Facebook Ads report might highlight campaign spend, conversions, and ROAS to answer a critical question: Is the current strategy delivering results, or does it need adjustment?
At its core, client reporting serves one purpose: demonstrating value while building transparency and trust between agencies and clients.
With that said, most modern client reports are delivered through reporting dashboards that automatically collect, visualize, and update performance data. Here are the three ways to build one using Two Minute Reports.
How to Create a Client Reporting Dashboard: 3 Simple Ways
There are multiple ways to create a client reporting dashboard. The best approach depends on how much time you want to spend building reports, how often you need to update them, and the level of customization your clients require.
Start by heading to the Two Minute Reports Hub. From there, you can choose how you want to build your dashboard. Here are they:
- Generate a dashboard using AI
- Start with a pre-built dashboard template
- Build a dashboard from scratch
Method 1: Create a Client Reporting Dashboard using AI
With Two Minute Reports’ AI dashboard builder, you can generate a fully functional client dashboard in minutes. Simply describe what you need in plain English, connect your accounts, and let AI build the dashboard for you. Instead of manually selecting charts, metrics, and layouts, AI automatically structures the report based on your requirements.
This approach is ideal for agencies that want to skip the manual dashboard setup and quickly turn their reporting requirements into a ready-to-use dashboard.
Here’s how it works:
- Enter a prompt describing the dashboard you want to create.
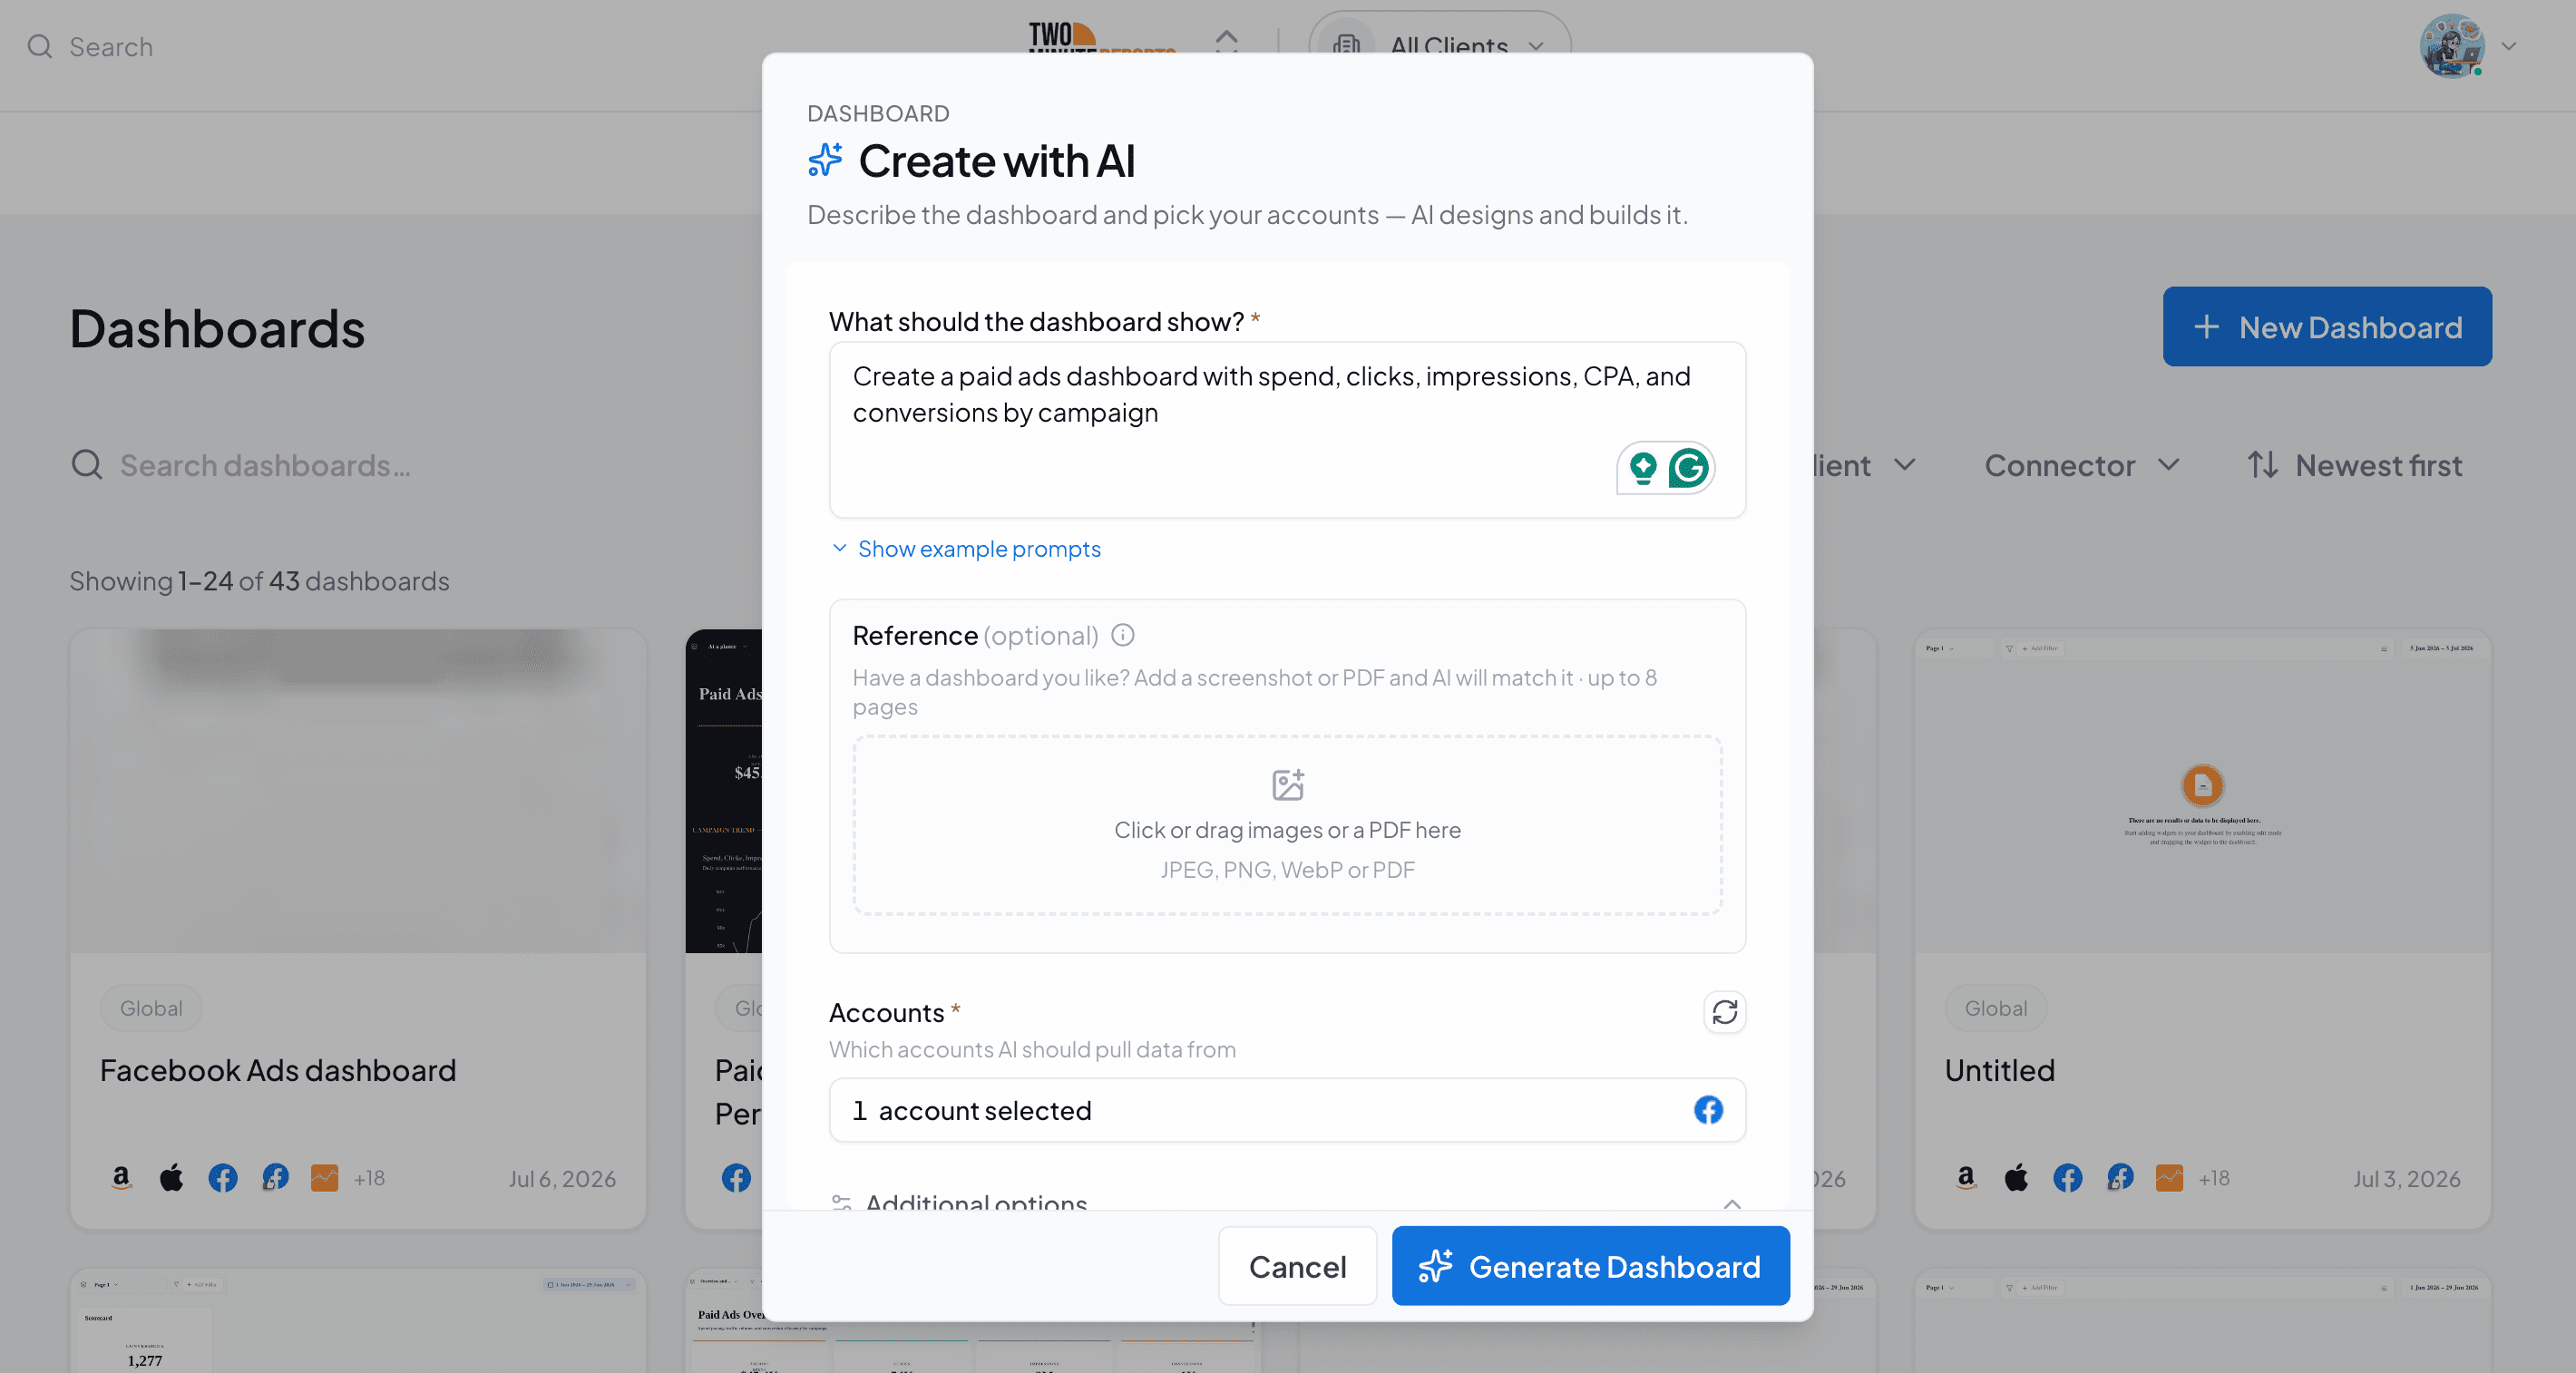
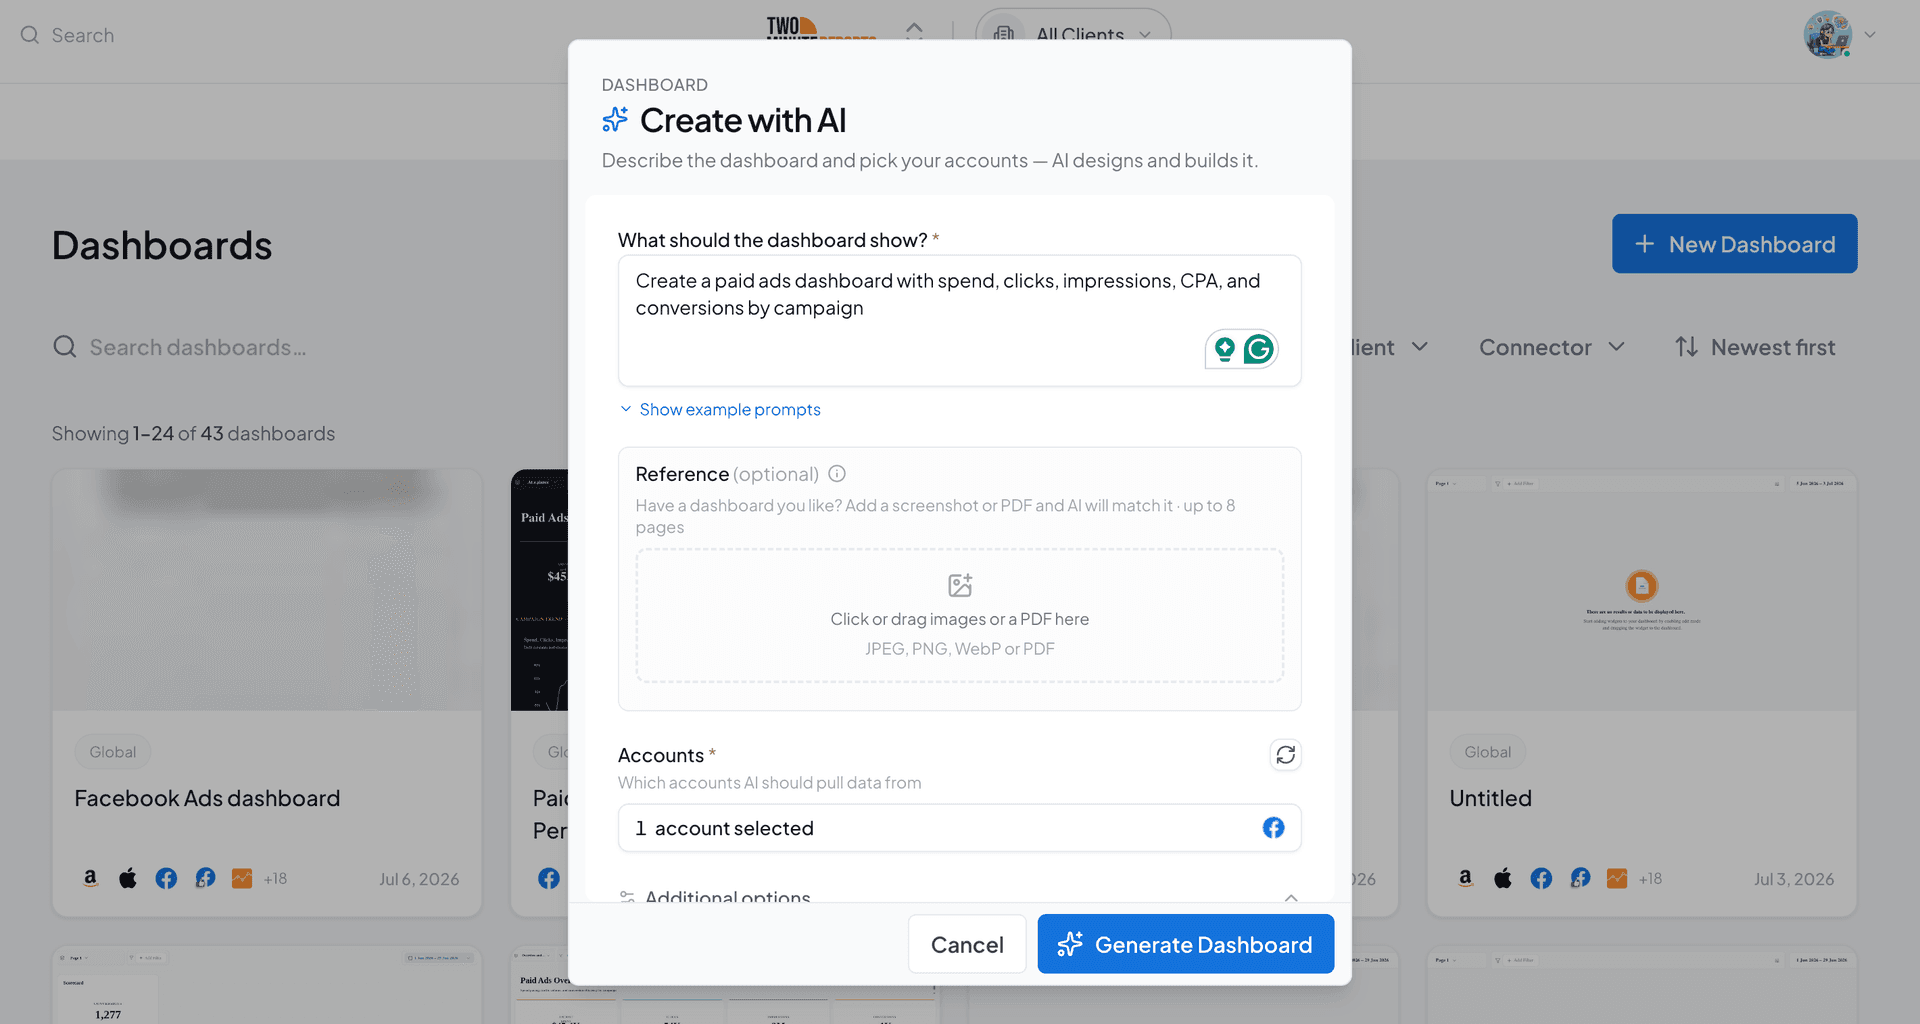
2. Select the client accounts you want to include.
3. Choose a dashboard theme or let AI recommend one. You can also upload reference images if you want the dashboard to be of that type.
4. Click Generate Dashboard to create the dashboard instantly.
5. Your dashboard is automatically populated with relevant metrics, giving you a clear, holistic view of campaign performance.
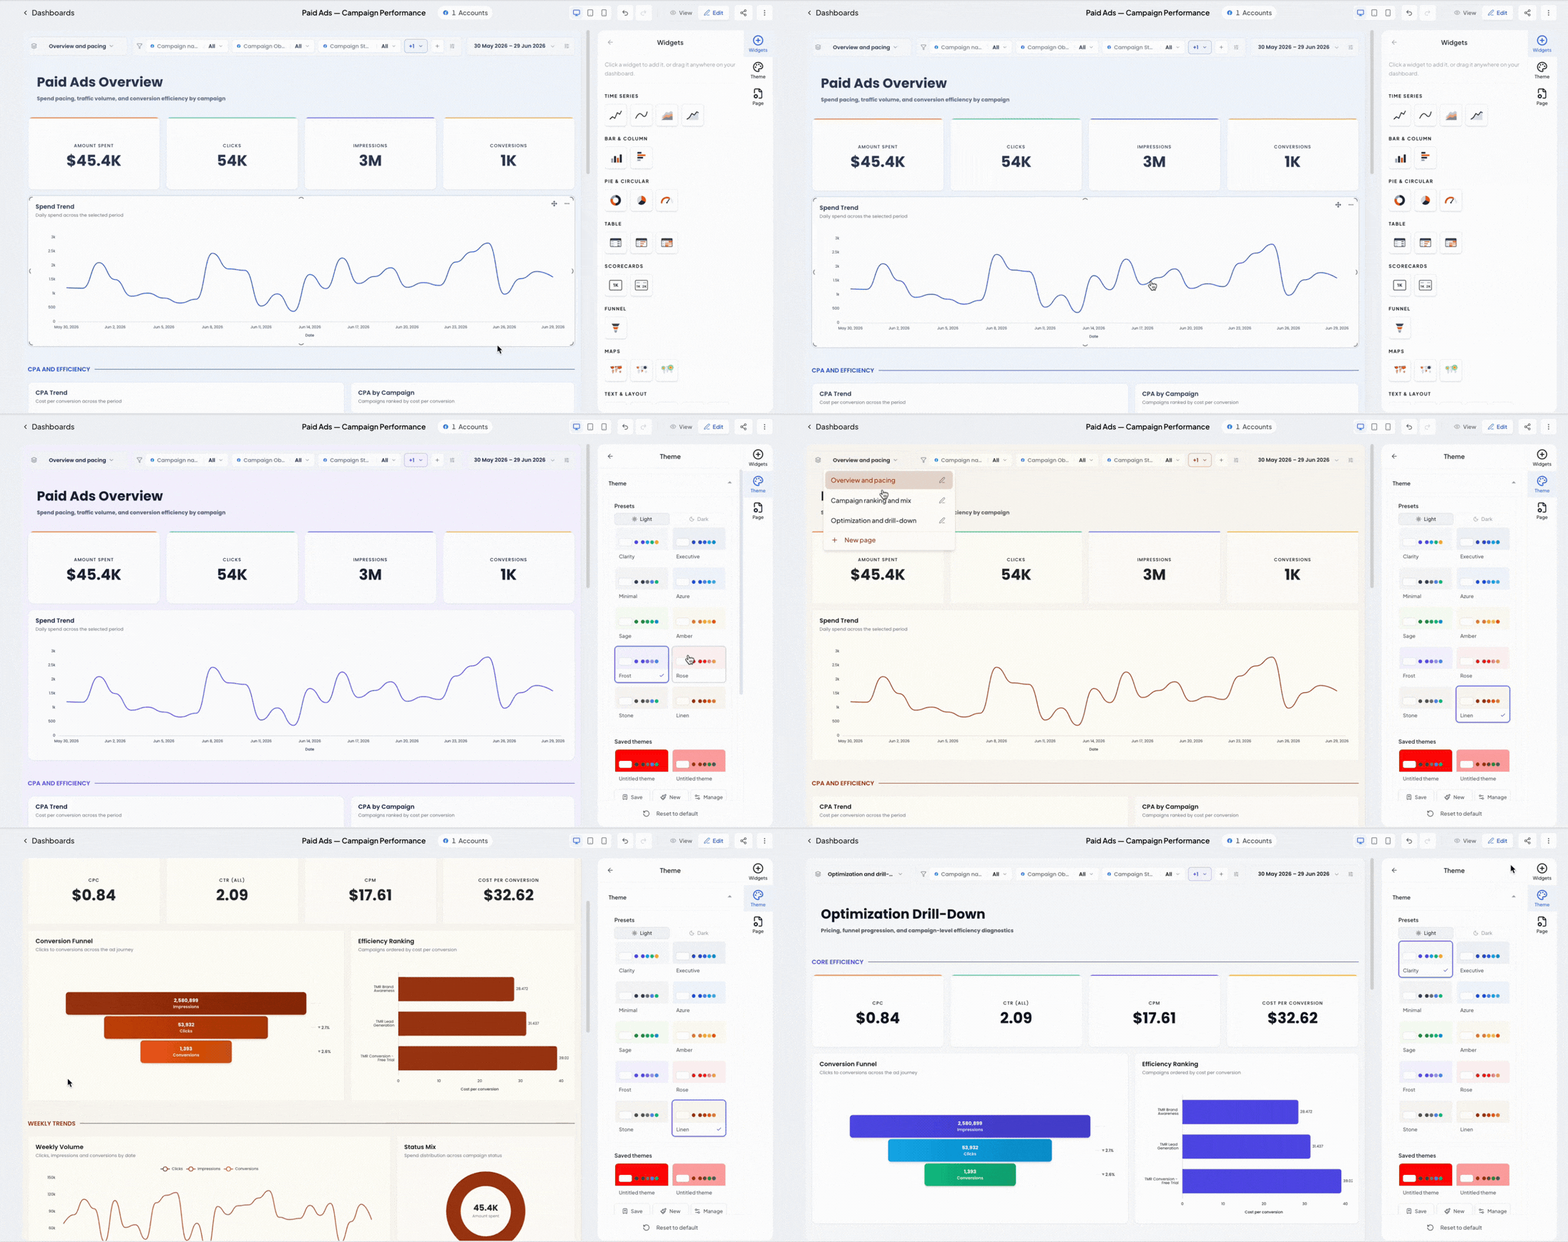
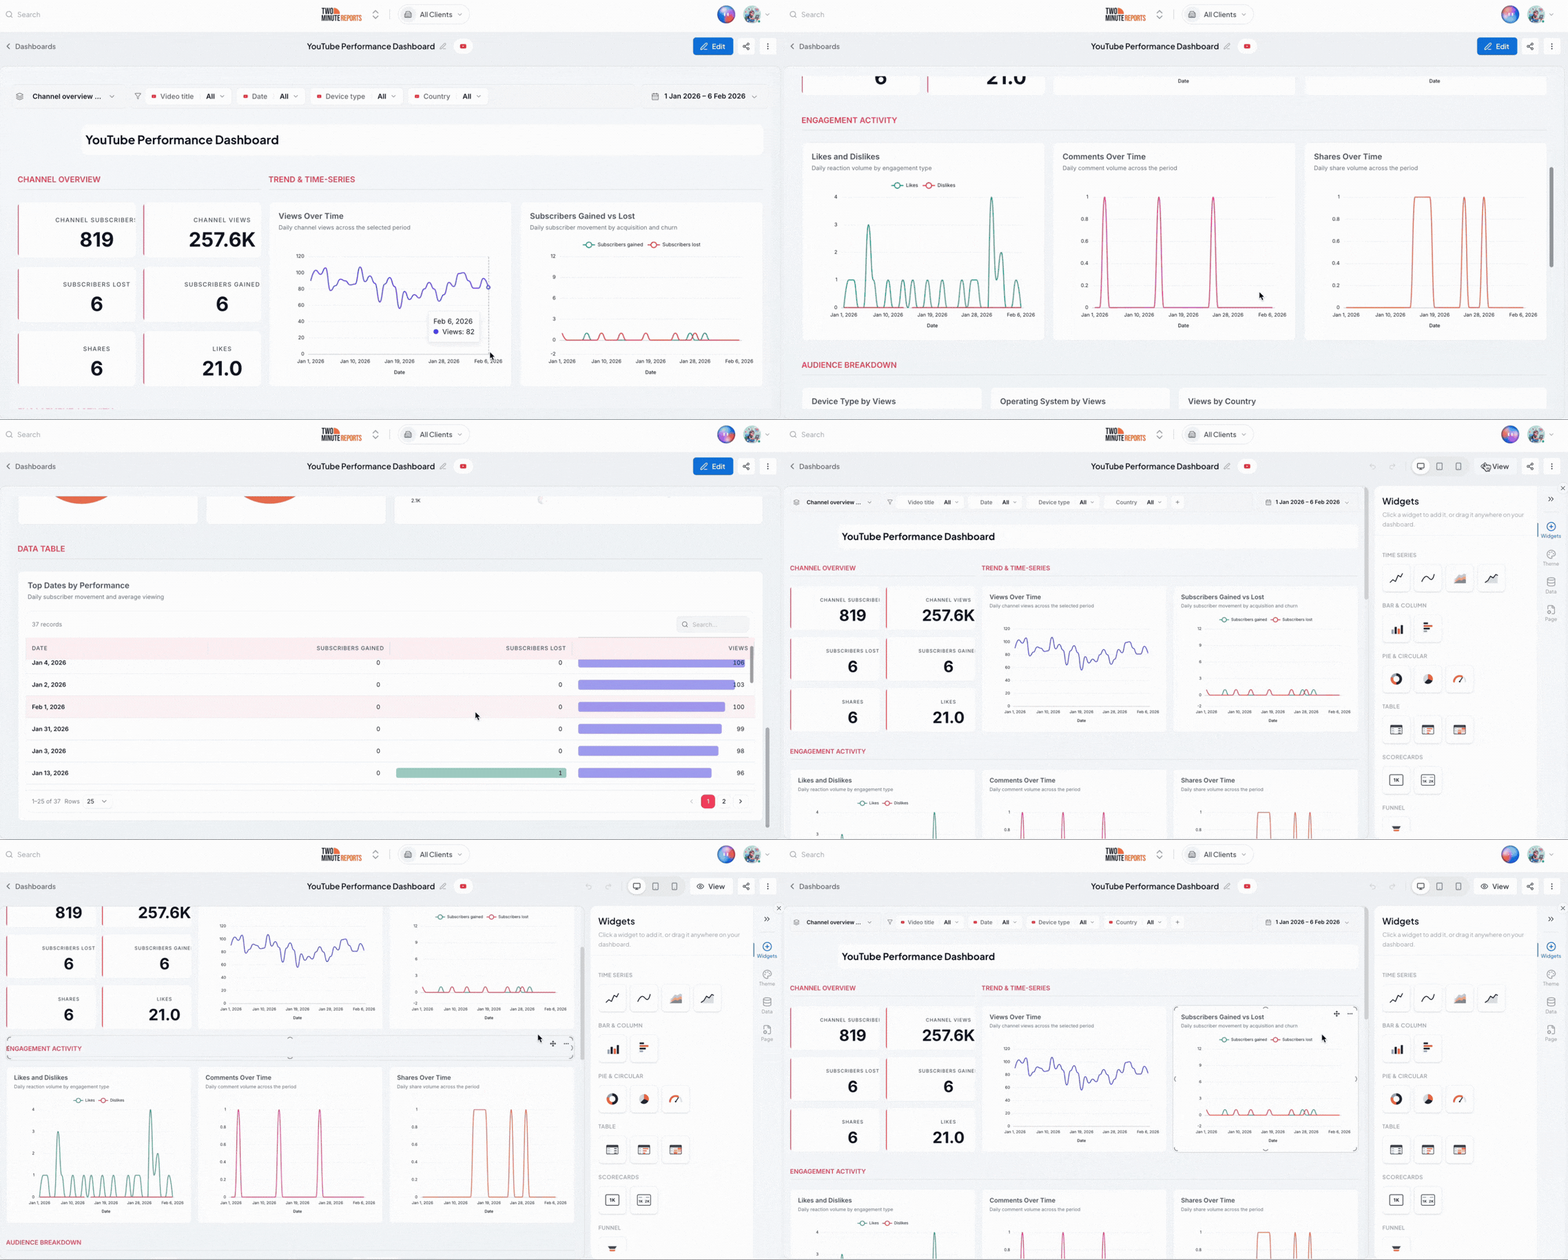
The dashboard above is an example of what you can create using AI. As you can see, the key insights are automatically populated in one place, making it easier for you to review campaign performance. You can then customize the widgets, branding, and layout before sharing the dashboard with your clients.
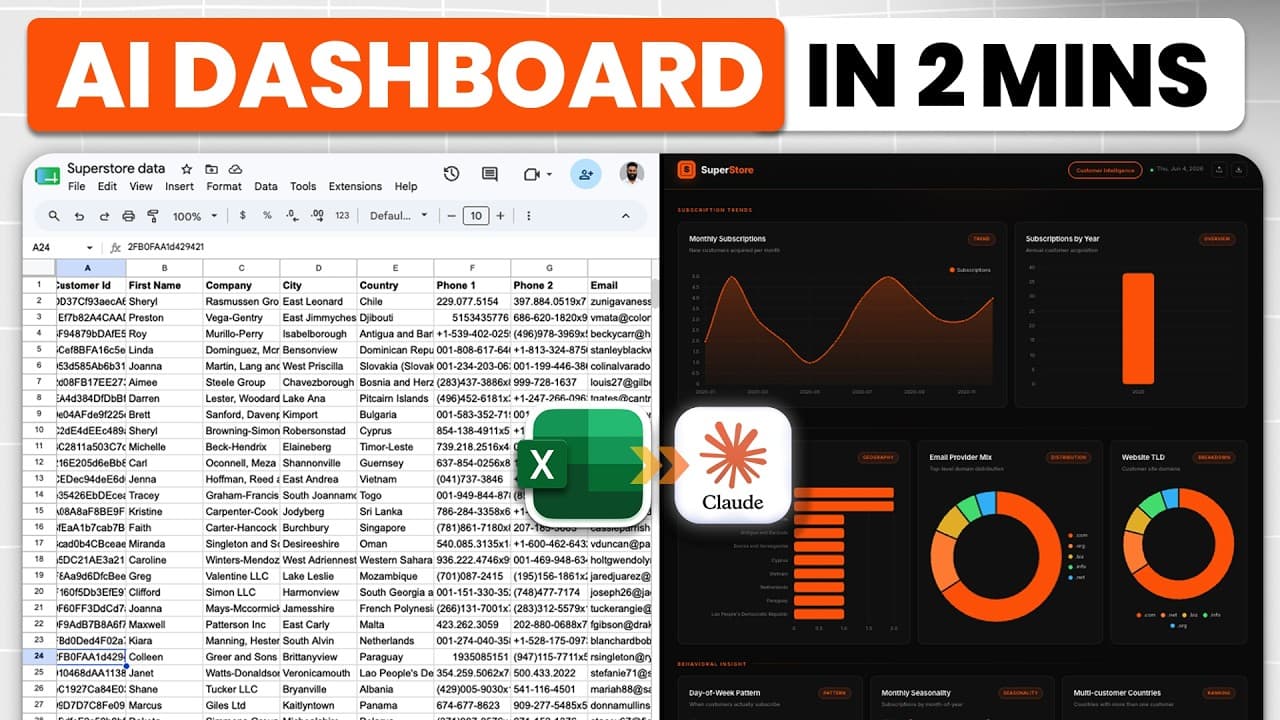
Want to see it built live? Watch as our host walks you through the entire client reporting process; from connecting your data sources to customizing the dashboard and sharing the final report with your client.

Method 2: Start with a pre-built dashboard template
A pre-built dashboard template lets you reuse the same layout across multiple clients while simply swapping the underlying data.
This approach is ideal for agencies that want to maintain consistency across multiple clients and streamline reporting workflows. It saves time and makes onboarding new clients much faster.
Two Minute Reports offers pre-built dashboard templates across platforms such as Facebook Ads, Amazon Seller. Google Ads, GA4, Shopify, etc. Here’s how it works:
- Browse the dashboard template gallery and choose a template that fits your reporting needs. Each template is designed for a specific use case, making it easier to find the right starting point.
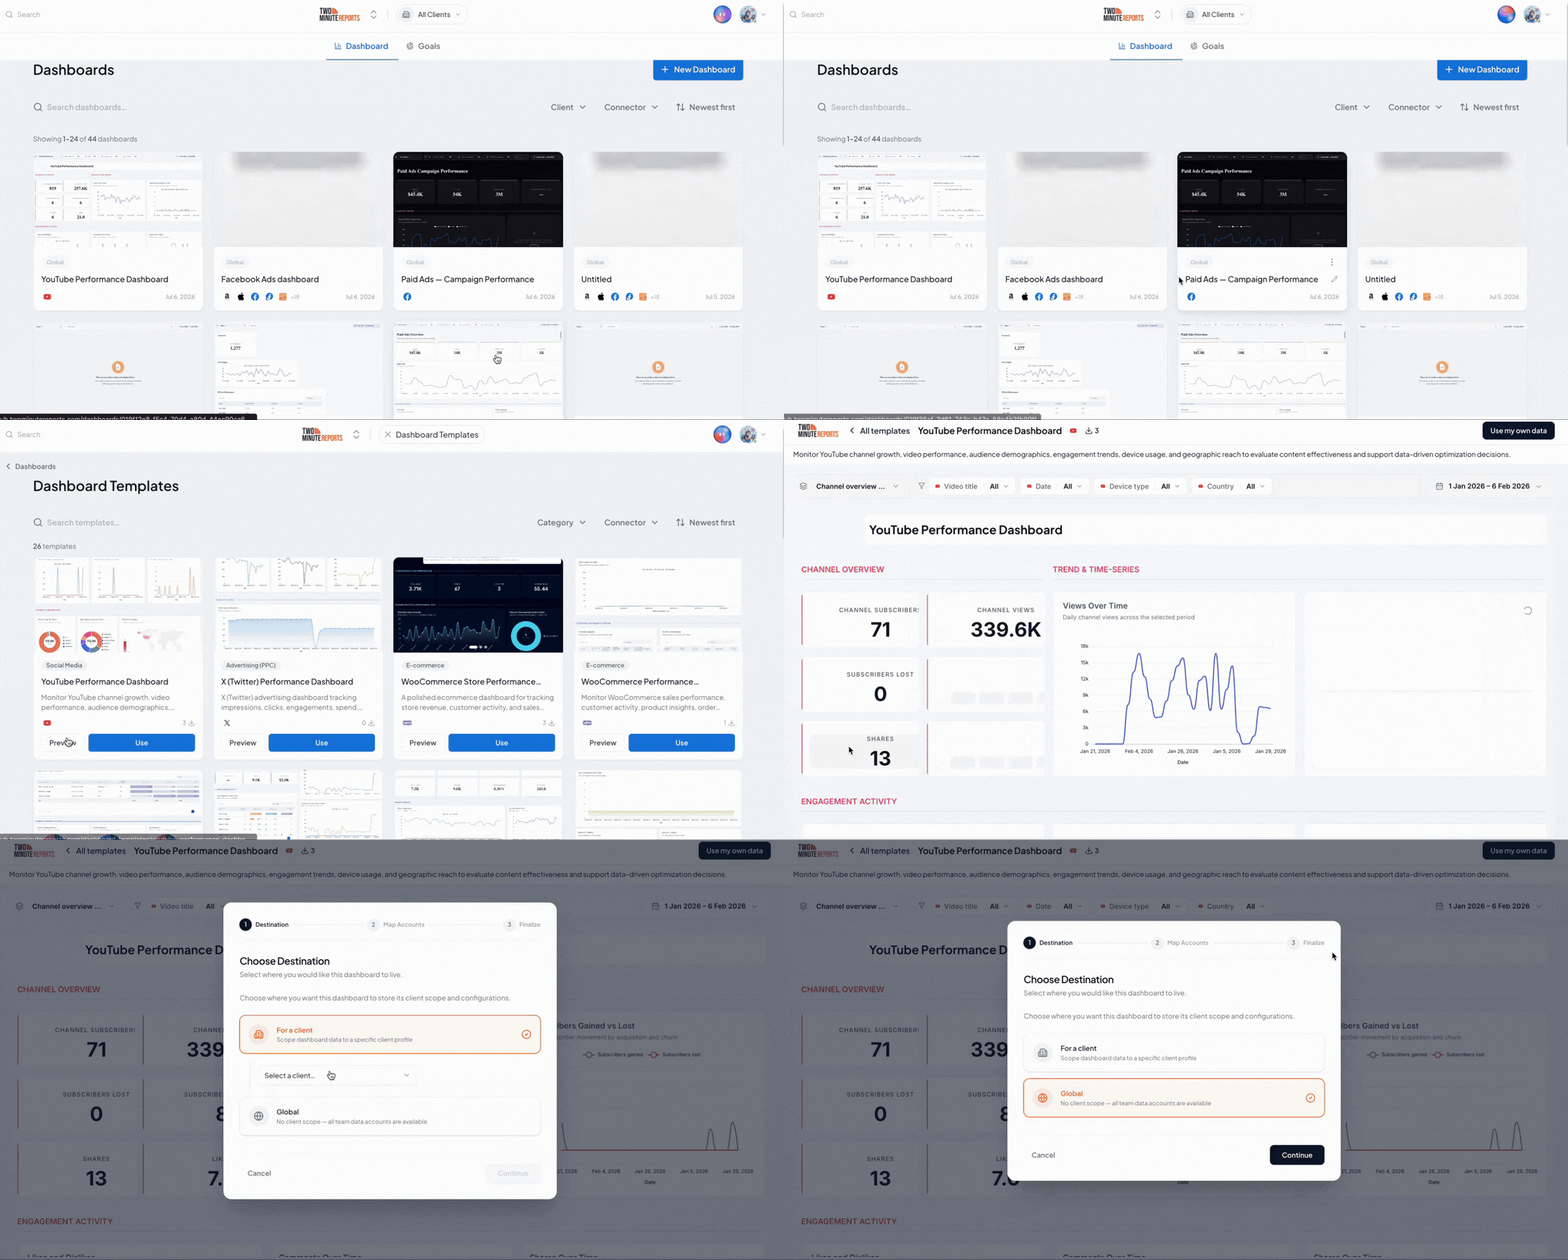
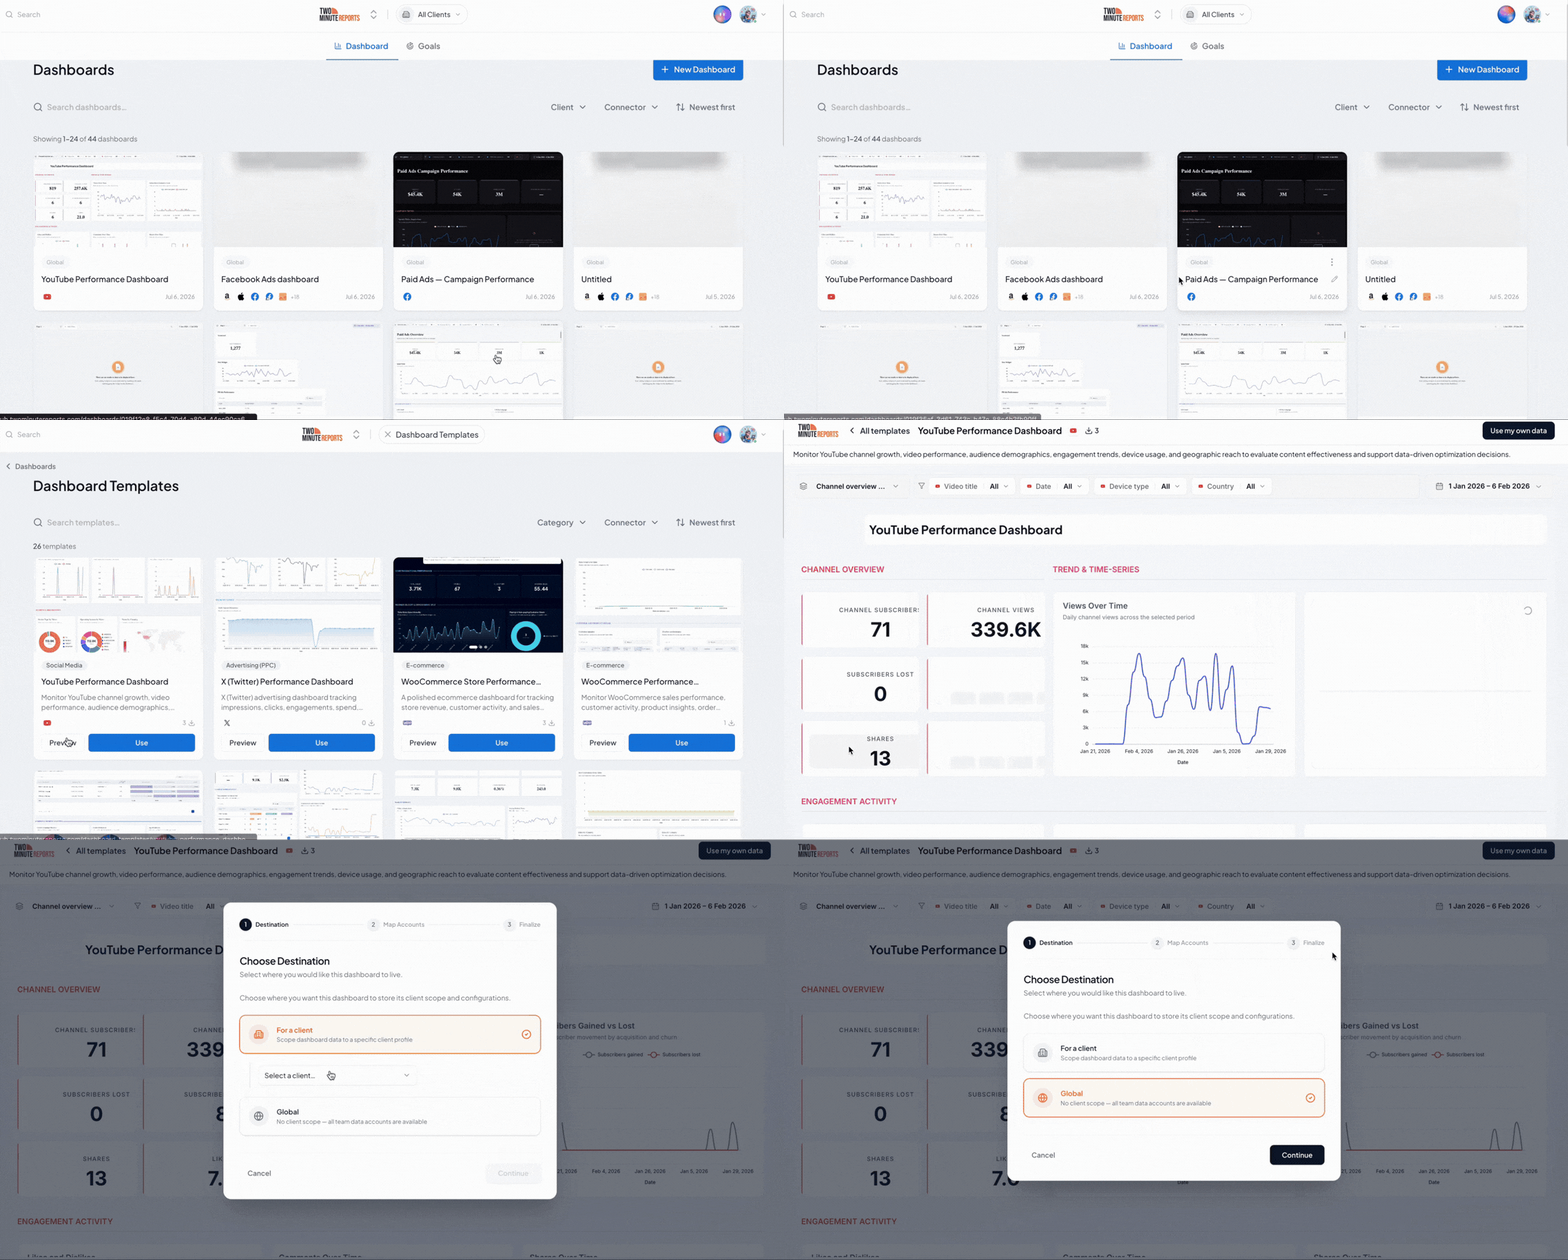
2. Next, select whether you want to report on a specific client account or aggregate data across multiple accounts.
3. Map the client accounts associated with the connector.
4. Click Create Dashboard.
From there, you can rename it, add or remove widgets, switch themes, adjust the date range, and make the dashboard truly yours within minutes.
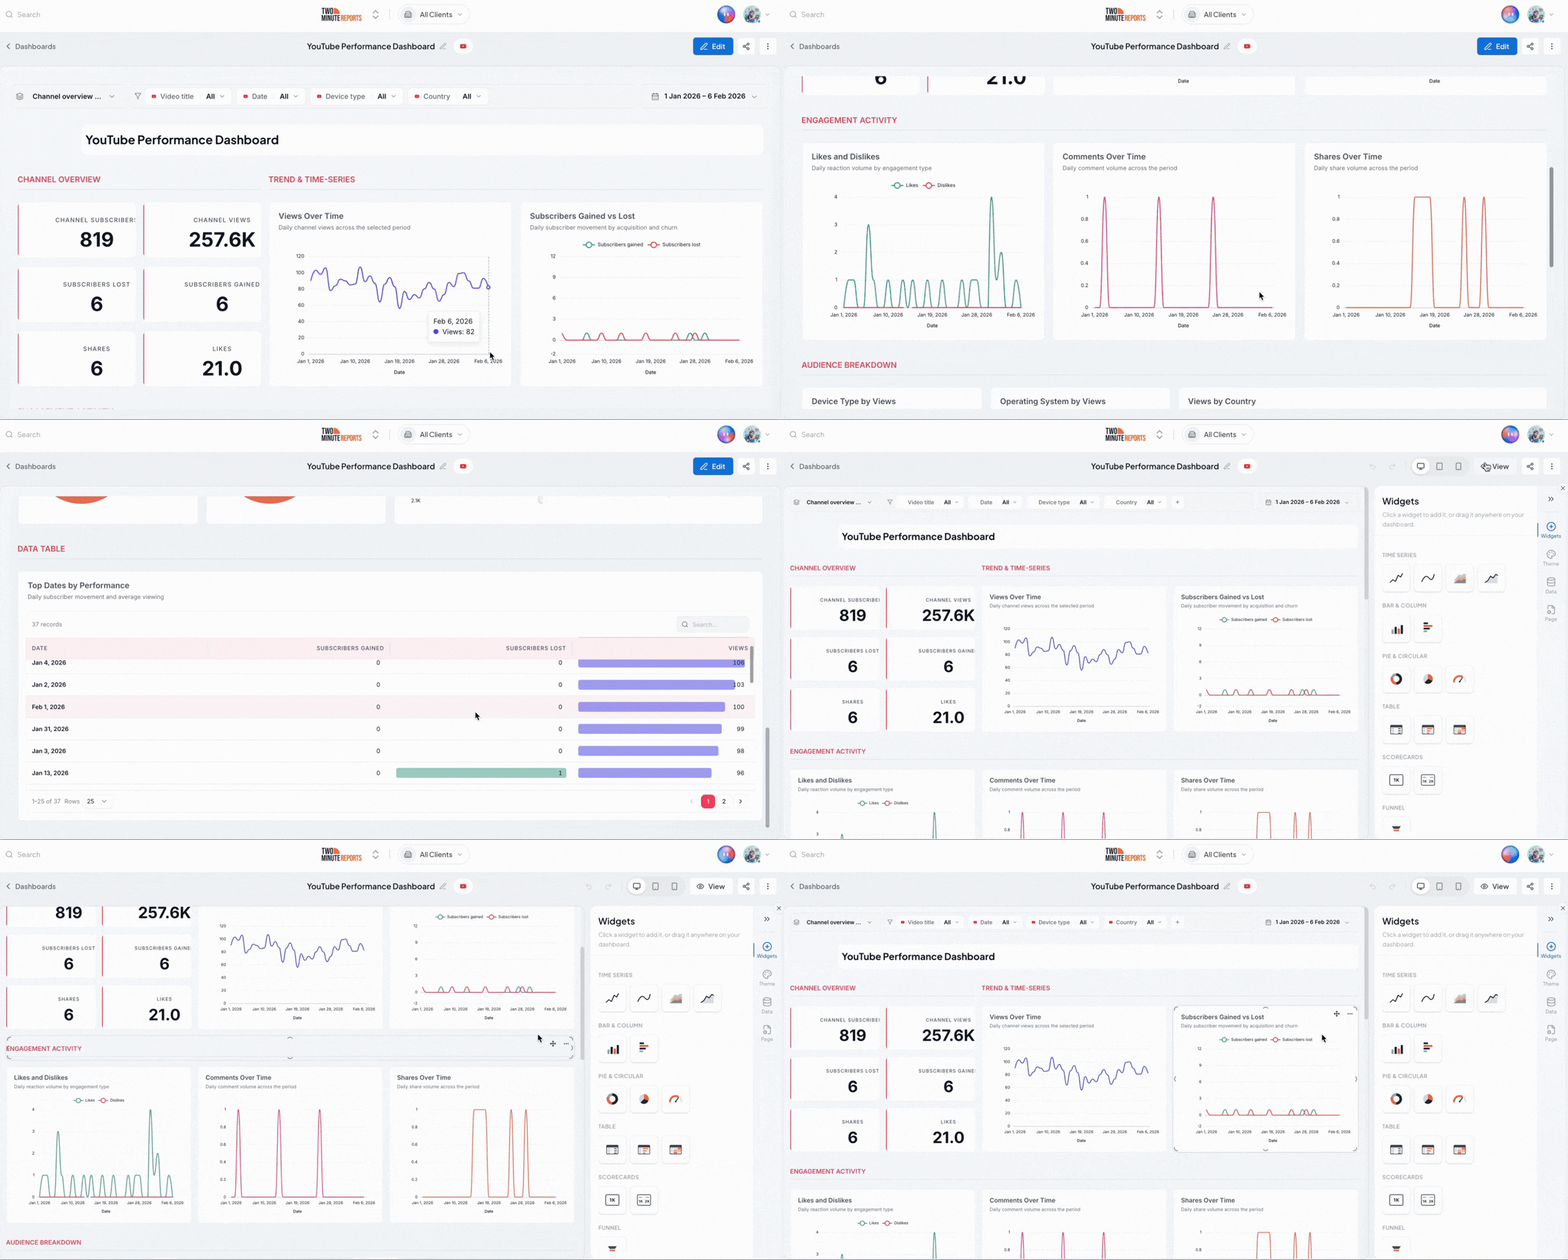
Note: Explore 20+ pre-built Two Minute Reports’ dashboard templates to deliver ready-to-share reports within minutes.
Method 3: Build a dashboard from scratch
Need complete control over your dashboard? Building from scratch doesn’t mean starting from zero. With Two Minute Reports, you can drag and drop widgets onto a blank canvas and design your dashboard exactly the way you want.
Here's how it works:
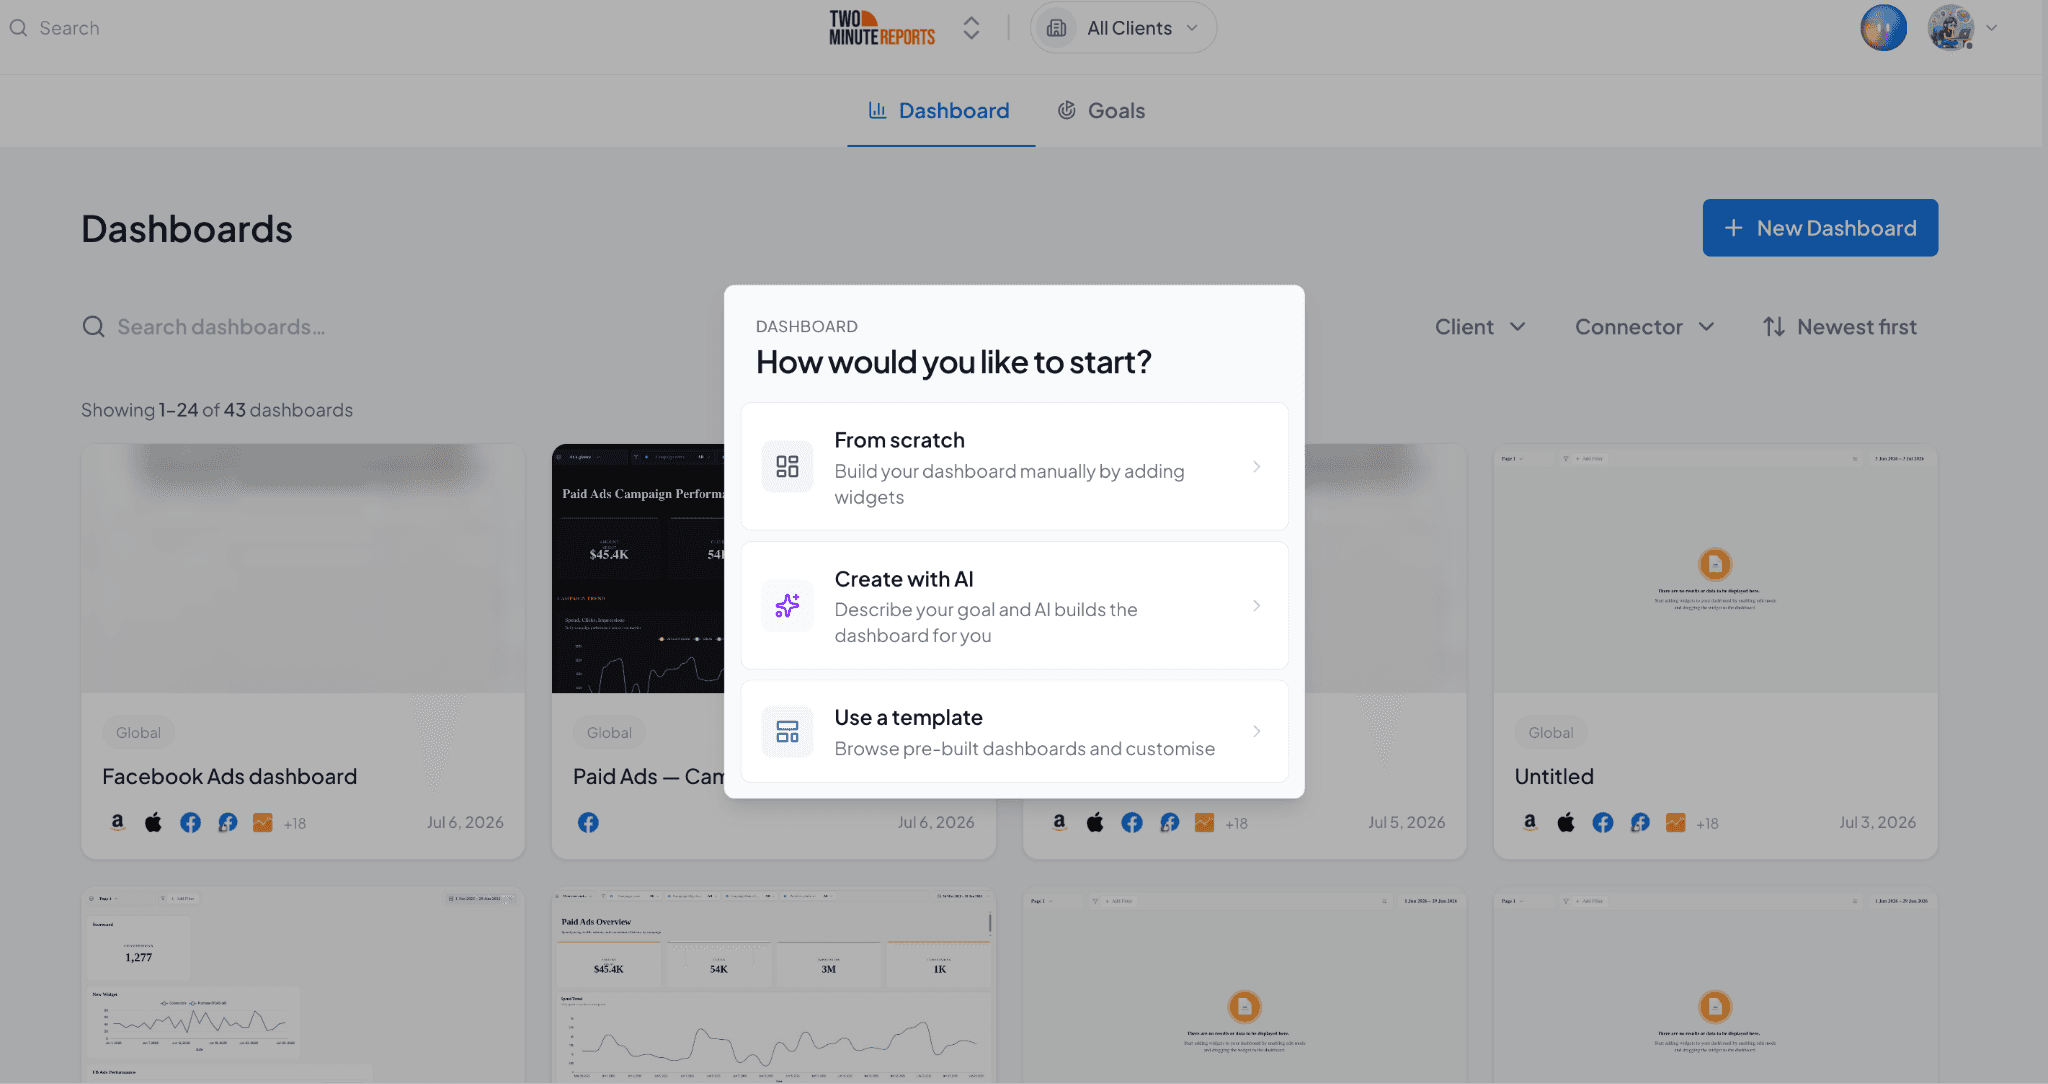
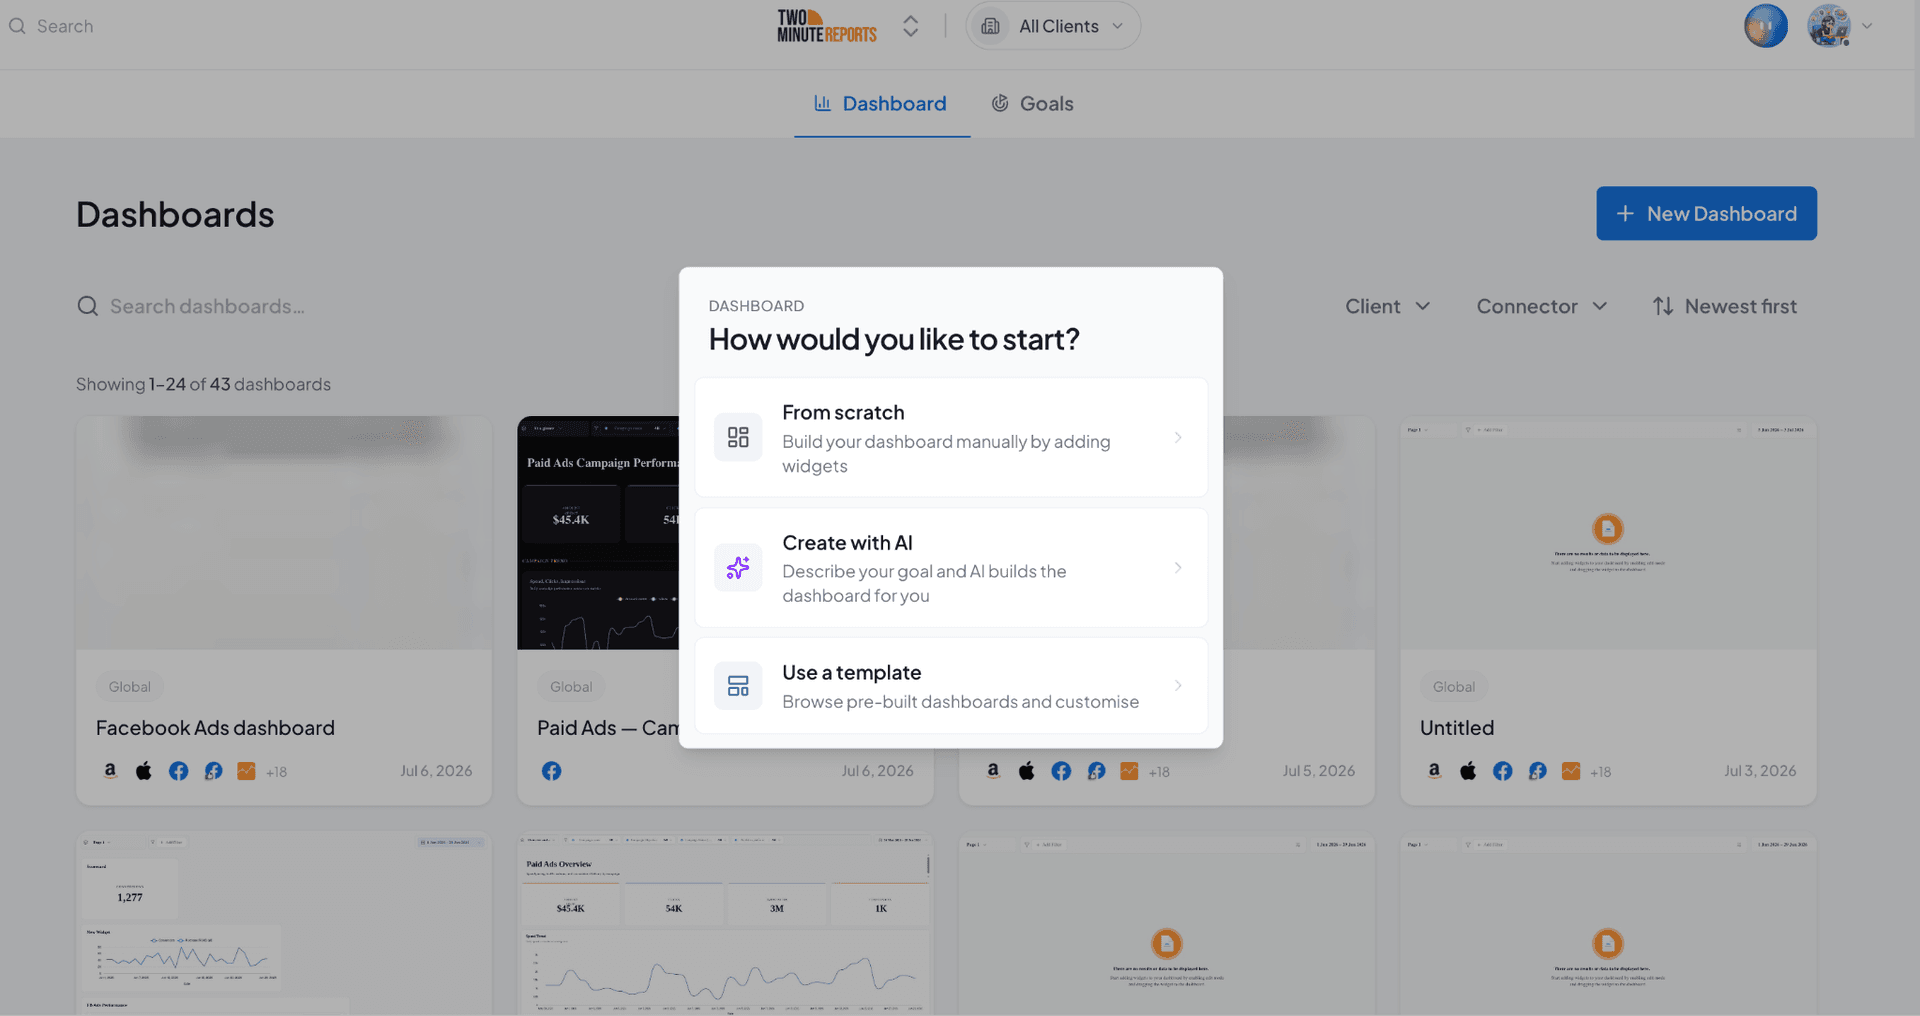
- Click New Dashboard and select From Scratch to start with a blank canvas.
2. The dashboard opens in edit mode, ready for you to add and arrange widgets.
3. Drag and drop widgets such as scorecards to highlight key KPIs, bar and line charts to compare performance and track trends, or tables to view detailed data.
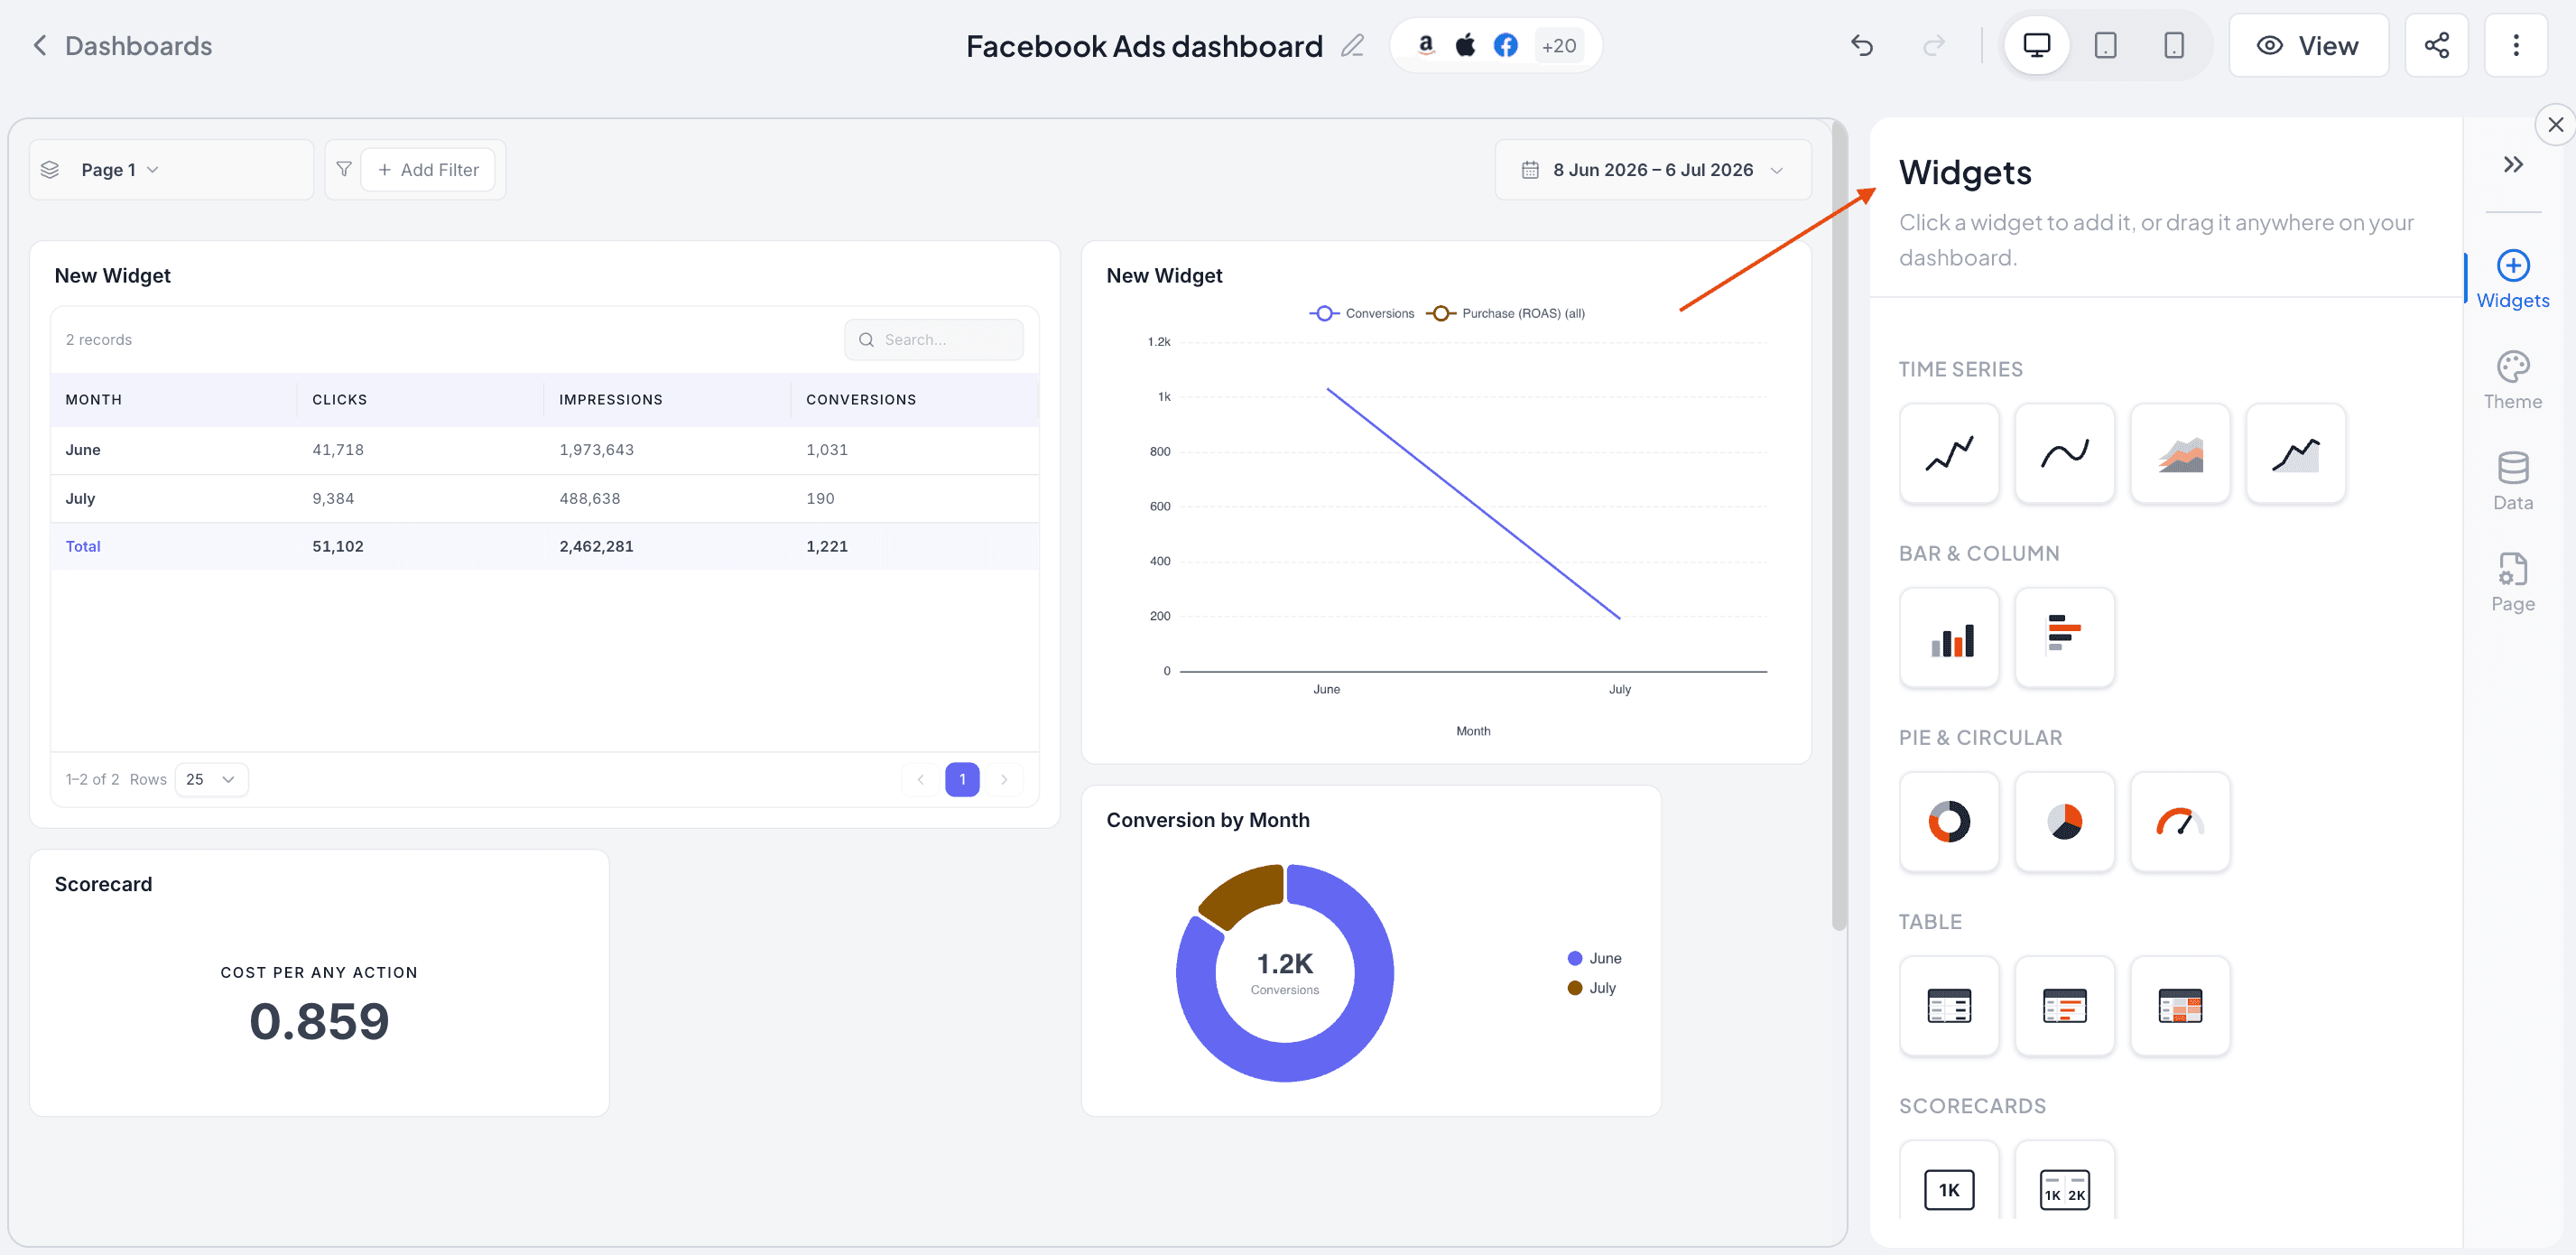
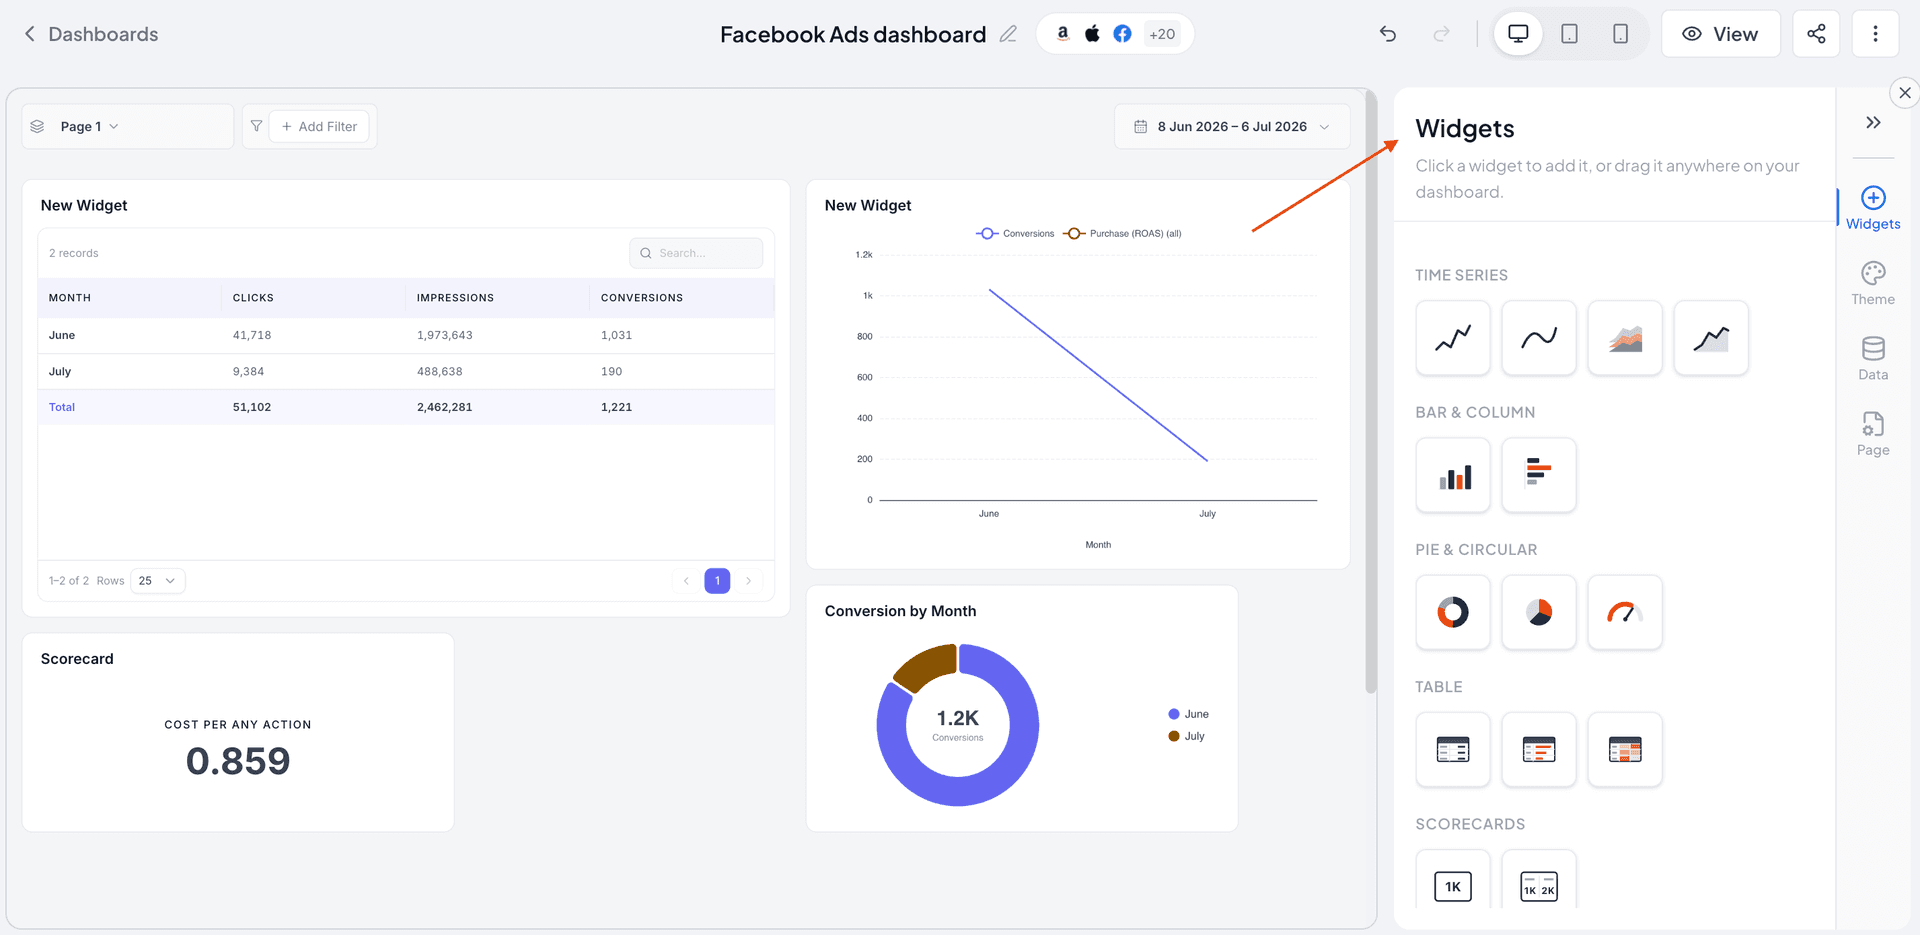
4. You can also choose from other chart types based on how you want to visualize your marketing data.
This approach is ideal when you need to highlight specific KPIs, create goal-driven reports, or build a complete custom marketing dashboard from scratch. Every widget, chart, and metric is under your control, giving you the flexibility to create marketing reports that match your client’s unique reporting requirements.
Make Your Dashboard Client-Ready and Share It
Once your dashboard is ready, you can fine-tune how it appears across devices and share it securely with clients.
Preview Your Dashboard Across Devices
Before sharing the dashboard, preview how it appears on desktop, tablet, and mobile. You can adjust the layout for each screen size to keep widgets and data easy to read.
Rearrange widgets for different breakpoints without creating separate dashboard versions. Any new widgets you add are also optimised for the selected layout.
Share the Dashboard With Your Clients
When you're ready to share, generate a secure dashboard link and send it directly to your client. You can password-protect the link, set an expiry date, and control which filters or date ranges viewers can change.
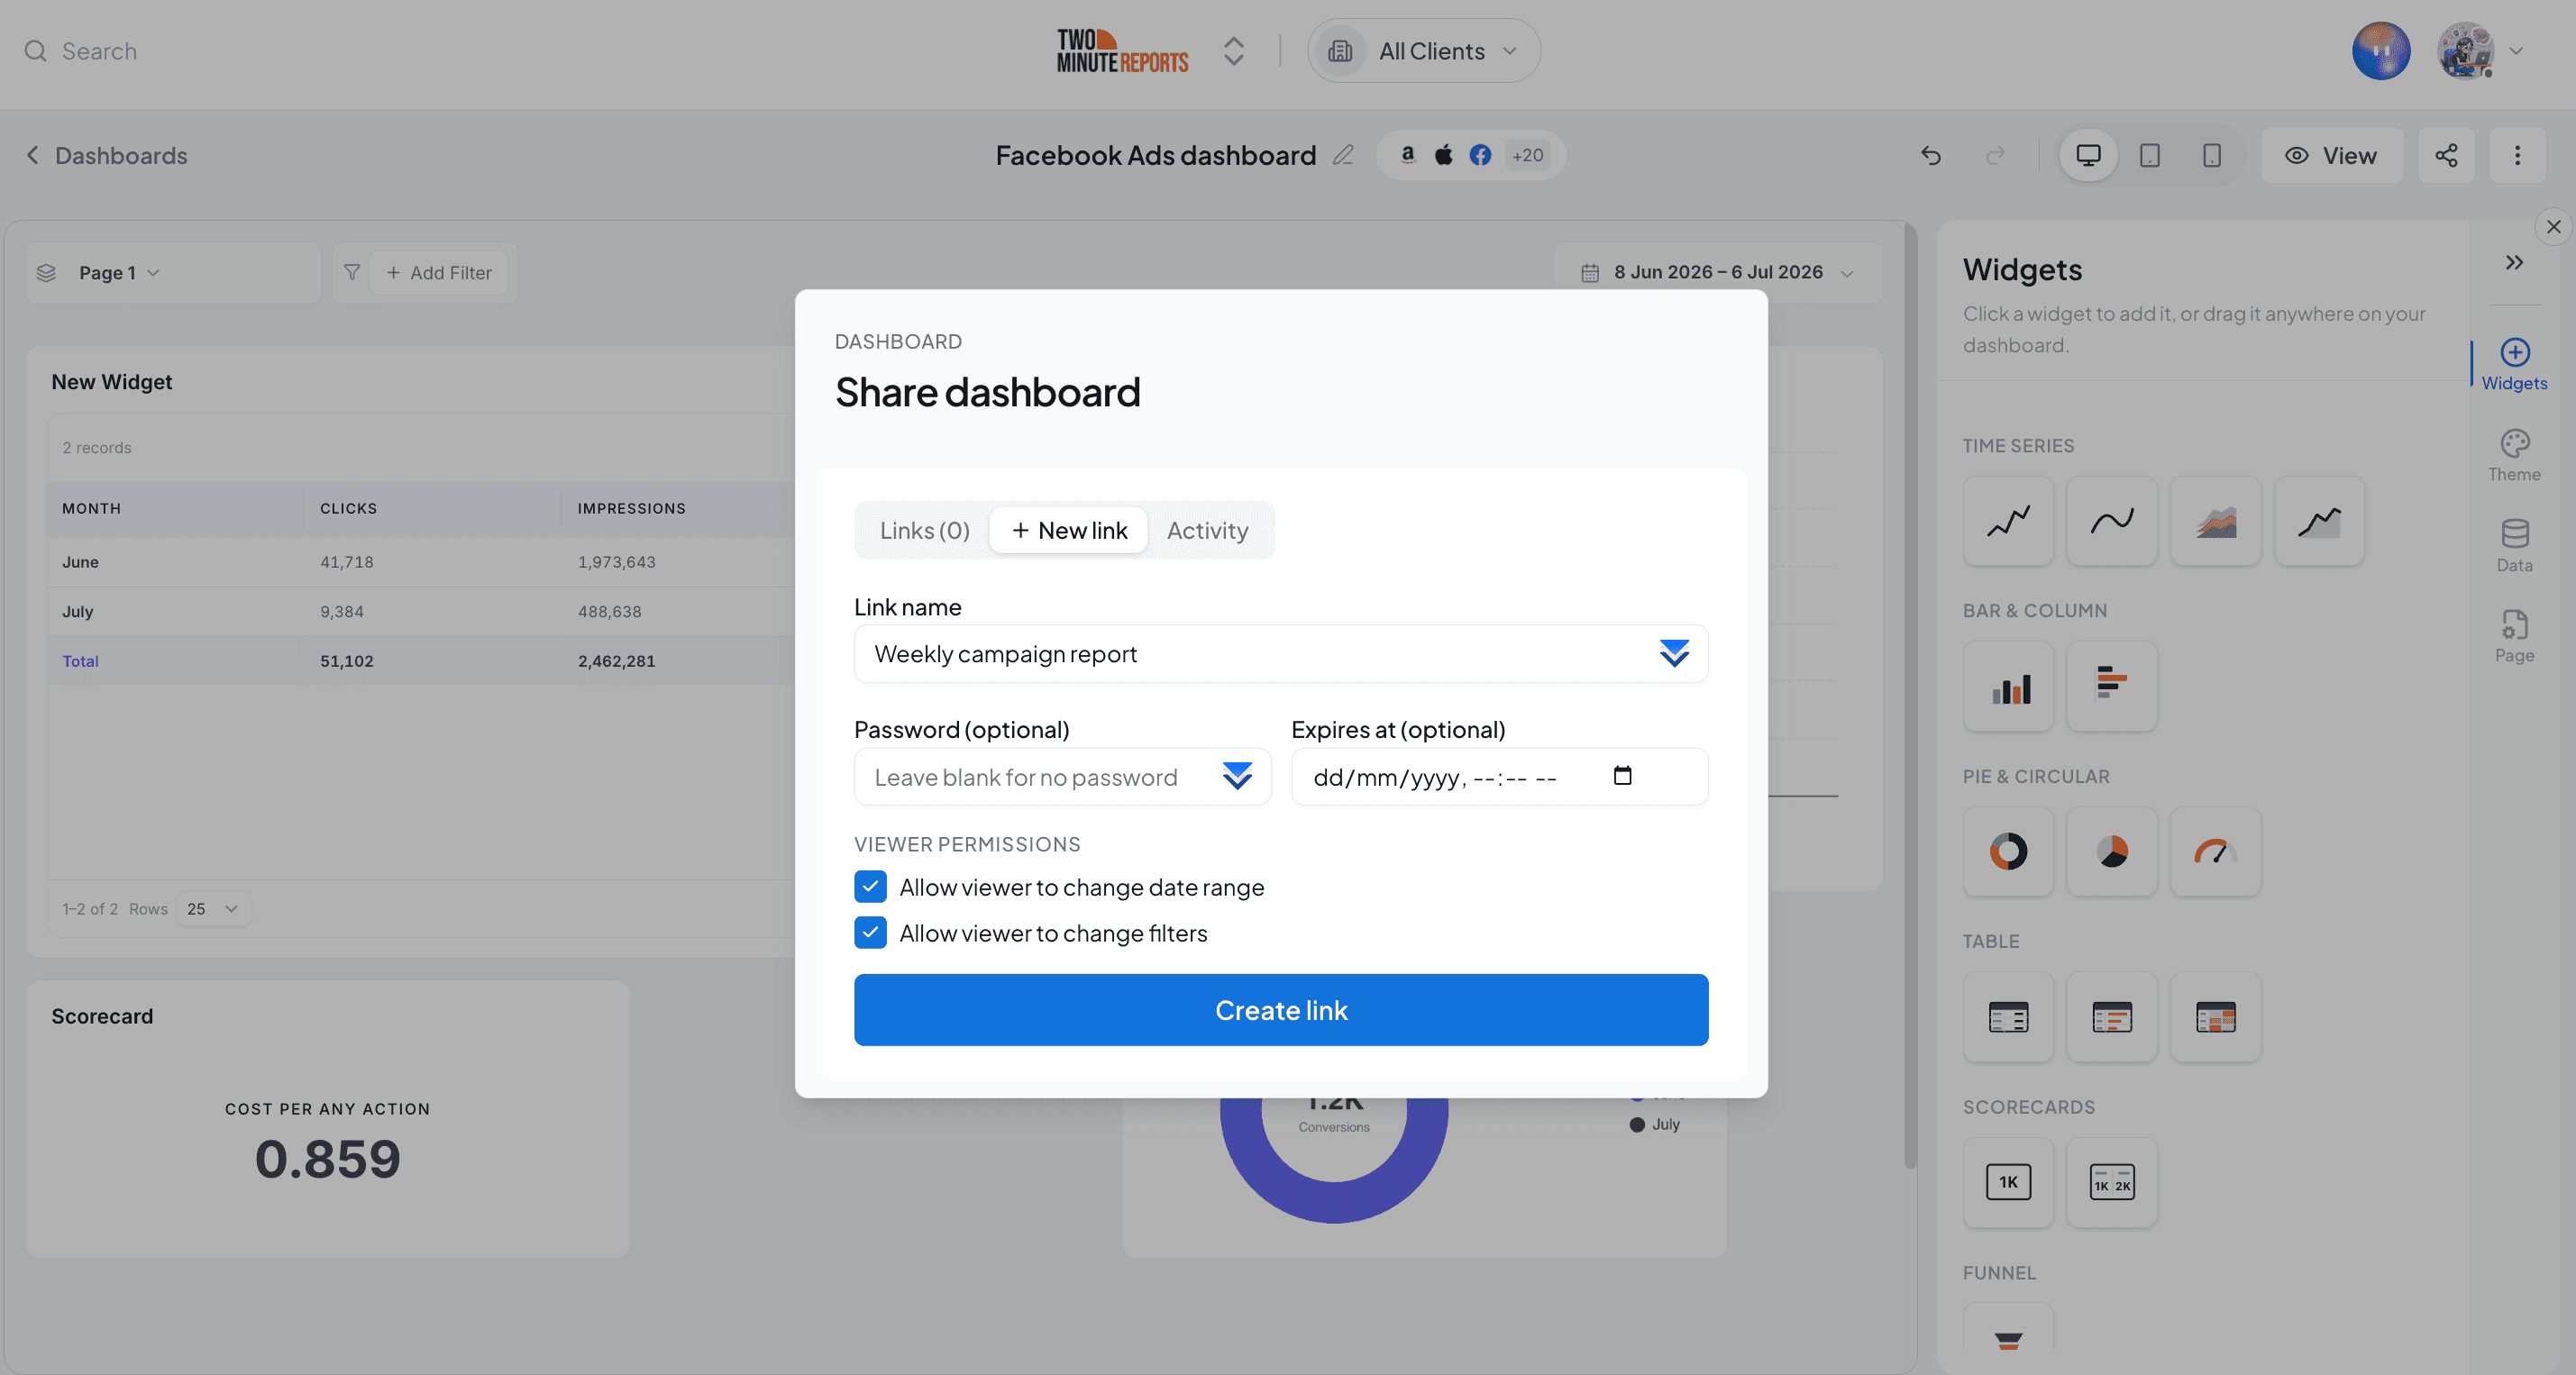
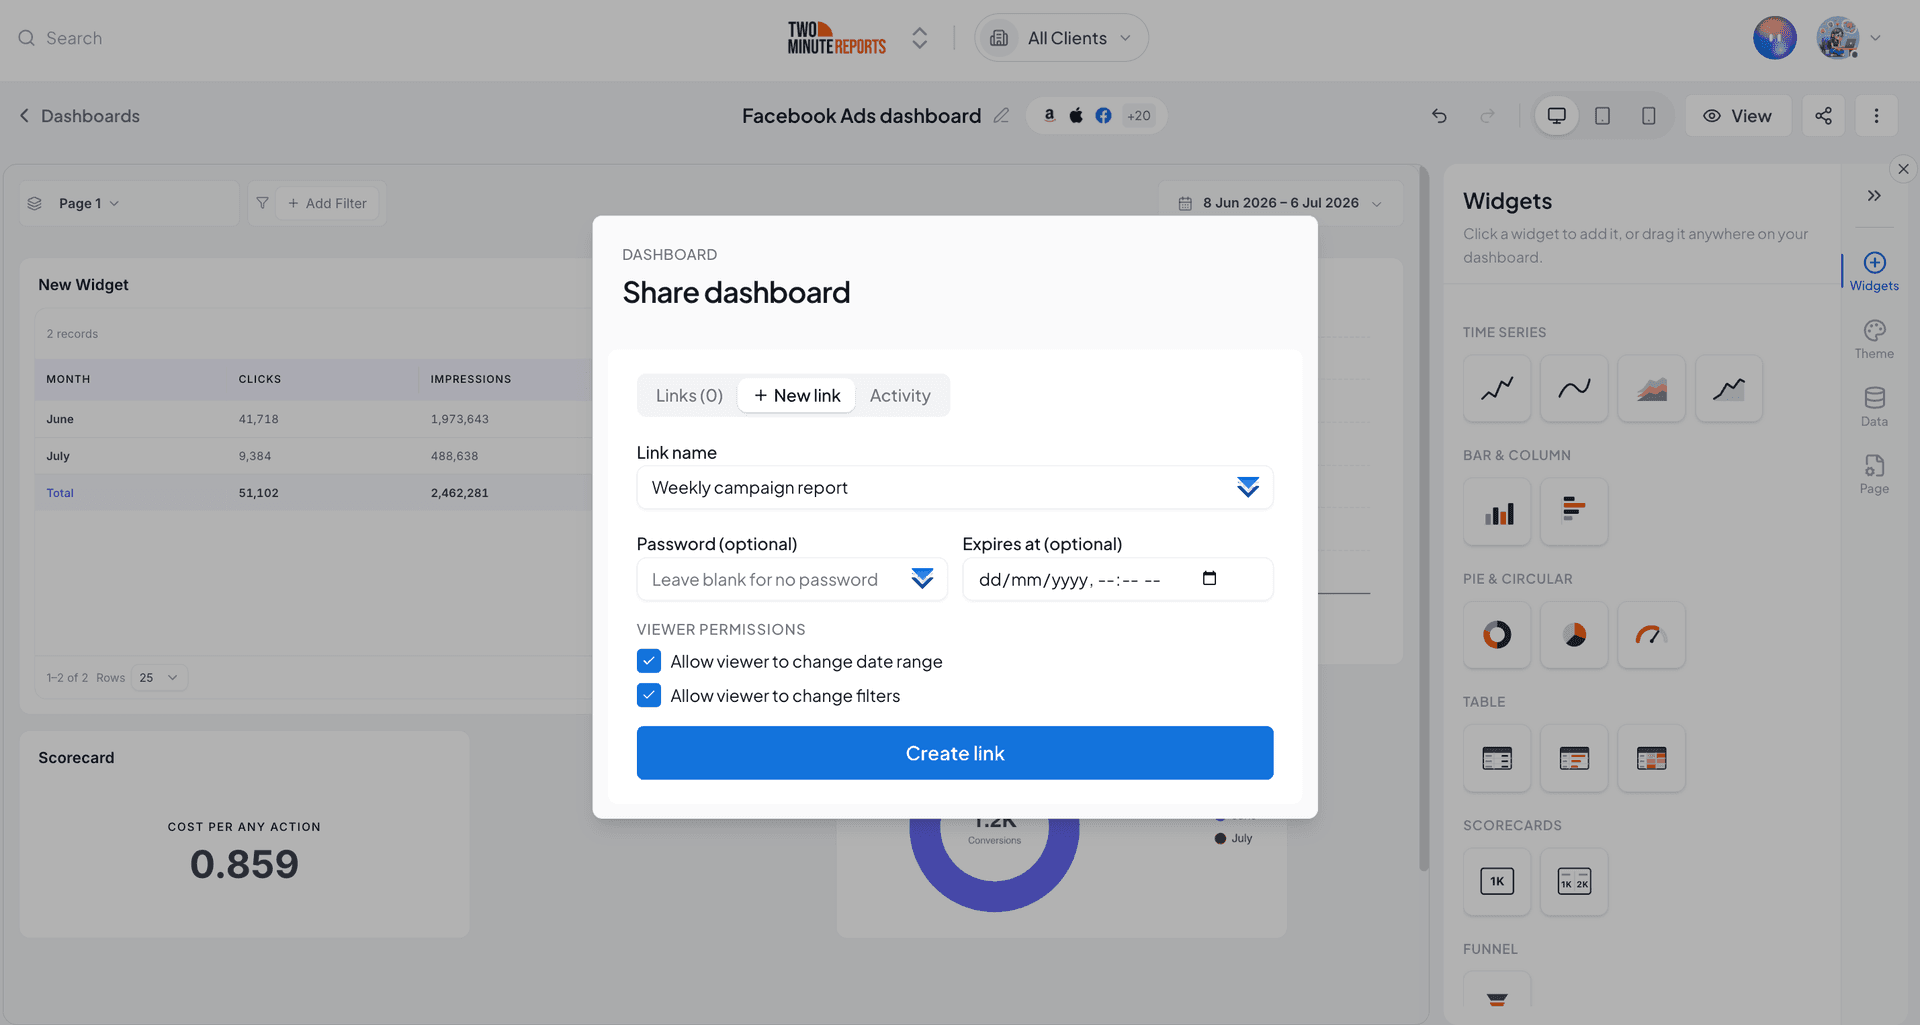
This gives clients access to the performance data they need while you stay in control of how they interact with the dashboard.
You can select the best method depending upon the speed, flexibility and customization ability.
Six Common Marketing Agency Reporting Mistakes to Avoid
In this section, I’ll walk you through the six common client reporting mistakes that hold back your agency’s efficiency and credibility.
1. Preparing excessively long reports
As an agency marketer, you might be tempted to include every intrinsic detail in the report. However, overwhelming your client with an excessively detailed report can make it difficult to extract meaningful insights, as they get lost in the sea of data.
Solution:
Focus on delivering in-depth insights that are easily digestible. Use clear headings, subheadings, bullet points, and summaries to highlight actionable takeaways in each section. Incorporate visual elements to comprehend complex data and turn it into impactful insights. Prioritize clarity and relevance to ensure that your clients can quickly grasp the value you are delivering.
2. Failing to demonstrate long-term goals
Every successful client-agency relationship starts with a long-term goal. However, agencies tend to focus heavily on short-term results, overlooking opportunities to leverage sustainable outcomes. As a result, clients may struggle to see the broader impact of their investments, letting potential insights slip through the cracks.
Solution:
Showcase the “before” and “after” of your marketing efforts, highlighting trends and historical data comparisons. Customize your reports with drag-and-drop widgets such as timelines, charts, and scorecards to showcase the bigger picture, reinforcing the speed and effectiveness of your marketing agency reporting.
3. Demonstrating selective insights
If you selectively highlight only the favourable outcomes, you create a narrative that highlights only the positive results, neglecting the full scope of data. This greatly hinders your ability to implement data-driven outcomes, ultimately impacting your client’s bottom line.
Solution:
Be transparent by demonstrating the full picture. Use this opportunity to explain how you can transform impediments into opportunities for success. Provide detailed insights on what was wrong, why it happened, and the corrective actions needed to move forward.
Doing so will help your clients understand your agency’s commitment to driving actionable goals and maximizing measurable results.
4. Not using client reporting to boost retention
Although improving revenue growth is a major challenge, many agencies overlook the potential of client reporting for upselling additional services. Focusing solely on delivering results without leveraging upselling tactics can inhibit your client’s growth and limit your ability to move beyond mundane data dumps.
Solution:
Spot actionable areas in your client report to recommend additional benefits. Next, connect those insights to new service opportunities, ensuring your reports are more than just numbers and visuals.
For example, if your campaign report shows high traffic but low engagement, you could leverage this opportunity to recommend future services, such as implementing targeted advertising and bidding to boost conversions.
5. Inconsistent reporting schedule
Determining the client reporting frequency is crucial to scaling data-driven insights. Failing to have a systematic approach will greatly impact your agency-client relationship. Your clients may be unclear about fixed deadlines and surprised by unexpected reporting outcomes.
Solution:
Set clear expectations for ideal reporting schedules. Use Two Minute Reports’ Schedule Refresh feature to deliver reports at your client’s preferred intervals. Maintain consistency by delivering reports in a uniform format such as PDF, Excel, or Spreadsheet. This ensures your clients receive timely, organized reports aligning with their needs and preferences.
6. Using the wrong visuals in client reporting
Sometimes, your visuals might be cluttered, complex, or clashing with your client's goals. For example, it wouldn't be the best choice if you were to report sales performance data for the past year using a pie chart because pie charts show the parts of a whole and do not show trends over time.
In such cases, your efforts to interpret actionable information could fall flat, confusing your clients and undermining the effectiveness of your report.
Solution:
Understand the type of data you want to represent and use appropriate visuals. Bar charts are great for comparing categories, whereas line graphs are ideal for showcasing trends. Use scatter plots to represent the correlation between variables.
Tailor your visuals to fit your clients' goals. Keep it straightforward, enabling your clients to make informed decisions easily.
Automate Client Reporting for Marketing Agencies
Creating client reports no longer has to be a repetitive, manual process.
Whether you prefer generating dashboards with AI, starting from a pre-built template, or building reports from scratch, Two Minute Reports gives you the flexibility to choose the workflow that fits your agency best.
And reporting doesn’t have to stop at the dashboards. By connecting your marketing data to Claude, ChatGPT or Manus through Two Minute Reports MCP, you can instantly generate executive summaries, spot what to optimize and receive actionable recommendations.
The goal is to create better reports that help your clients make faster, data-driven decisions while giving your team more time to focus on strategy and execution.
Start your 14-day free trial of Two Minute Reports and experience a faster, smarter way to create, automate, and optimize client reporting.
Frequently Asked Questions
Client performance reporting lets you deliver valuable insights about your client’s marketing campaigns to support informed decisions. You can track custom KPIs and measure how your strategies have impacted the overall ROI outcome, relative to your client’s goals.
The main purpose of a client report is to fine-tune raw data into insightful outcomes, helping you proactively optimize key business decisions to maximize the bottom line.
A client reporting template lets you centralize KPIs, monitor performance in real-time, and streamline analysis for improved efficiency. With seamless customization, you can drive actionable insights that elevate your client’s goals, enabling you to make informed decisions.
Gain a clear understanding of your client’s objectives and map relevant KPIs to guide your strategy. Use engaging visuals to contextualize your data and provide practical recommendations to move forward with accurate data-driven decisions.
Yes. With Two Minute Reports MCP integration, you can connect your marketing data to AI tools like Claude, ChatGPT or Manus. Ask questions about campaign performance, analyze trends, and turn your client data into actionable insights using simple prompts.
You can try Two Minute Reports free for 14 days. During the trial, you can connect your client accounts, build your first report, and explore key reporting features before deciding if it’s right for you.
Related Blogs





Meet the Author
Shalini MuruganShalini is driven by ideas that create a tangible impact. At Two Minute Reports, she specializes in content that helps marketers optimize their reporting workflows. When she's not transforming complex data into meaningful insights, you might find her lost in a book, jotting down ideas in her notebook, or connecting the dots others overlook.

