
Summarize this blog post with:
Connecting Google Ads to Google Data Studio makes it easier to turn your advertising data into actionable dashboards. With the right setup, you can bring campaign performance data into a centralized dashboard, monitor key metrics, and quickly identify what’s driving results.
In this guide, I’ll show you how to connect Google Ads to Data Studio using Two Minute Reports. You’ll also find free Google Ads Data Studio templates you can use to build custom campaign dashboards faster.
How to Connect Google Ads to Data Studio?
You can connect Google Ads to Data Studio using the following methods:
- Method 1: Connect Google Ads to Google Data Studio via Two Minute Reports Hub.
- Method 2: Connect Google Ads to Google Data Studio using pre-built templates.
Method 1: Connect Google Ads to Data Studio via TMR Hub
Two Minute Reports Hub is your dedicated workspace for adding, organising, and managing your Google Ads reporting workflow. Here’s how to get started:
Step 1: Creating a Connection
1. Go to hub.twominutereports.com and click Connections → Create Connection.


2. Inside the dialog box, complete these three steps:
- Select Google Ads from the list of options. Click Next.
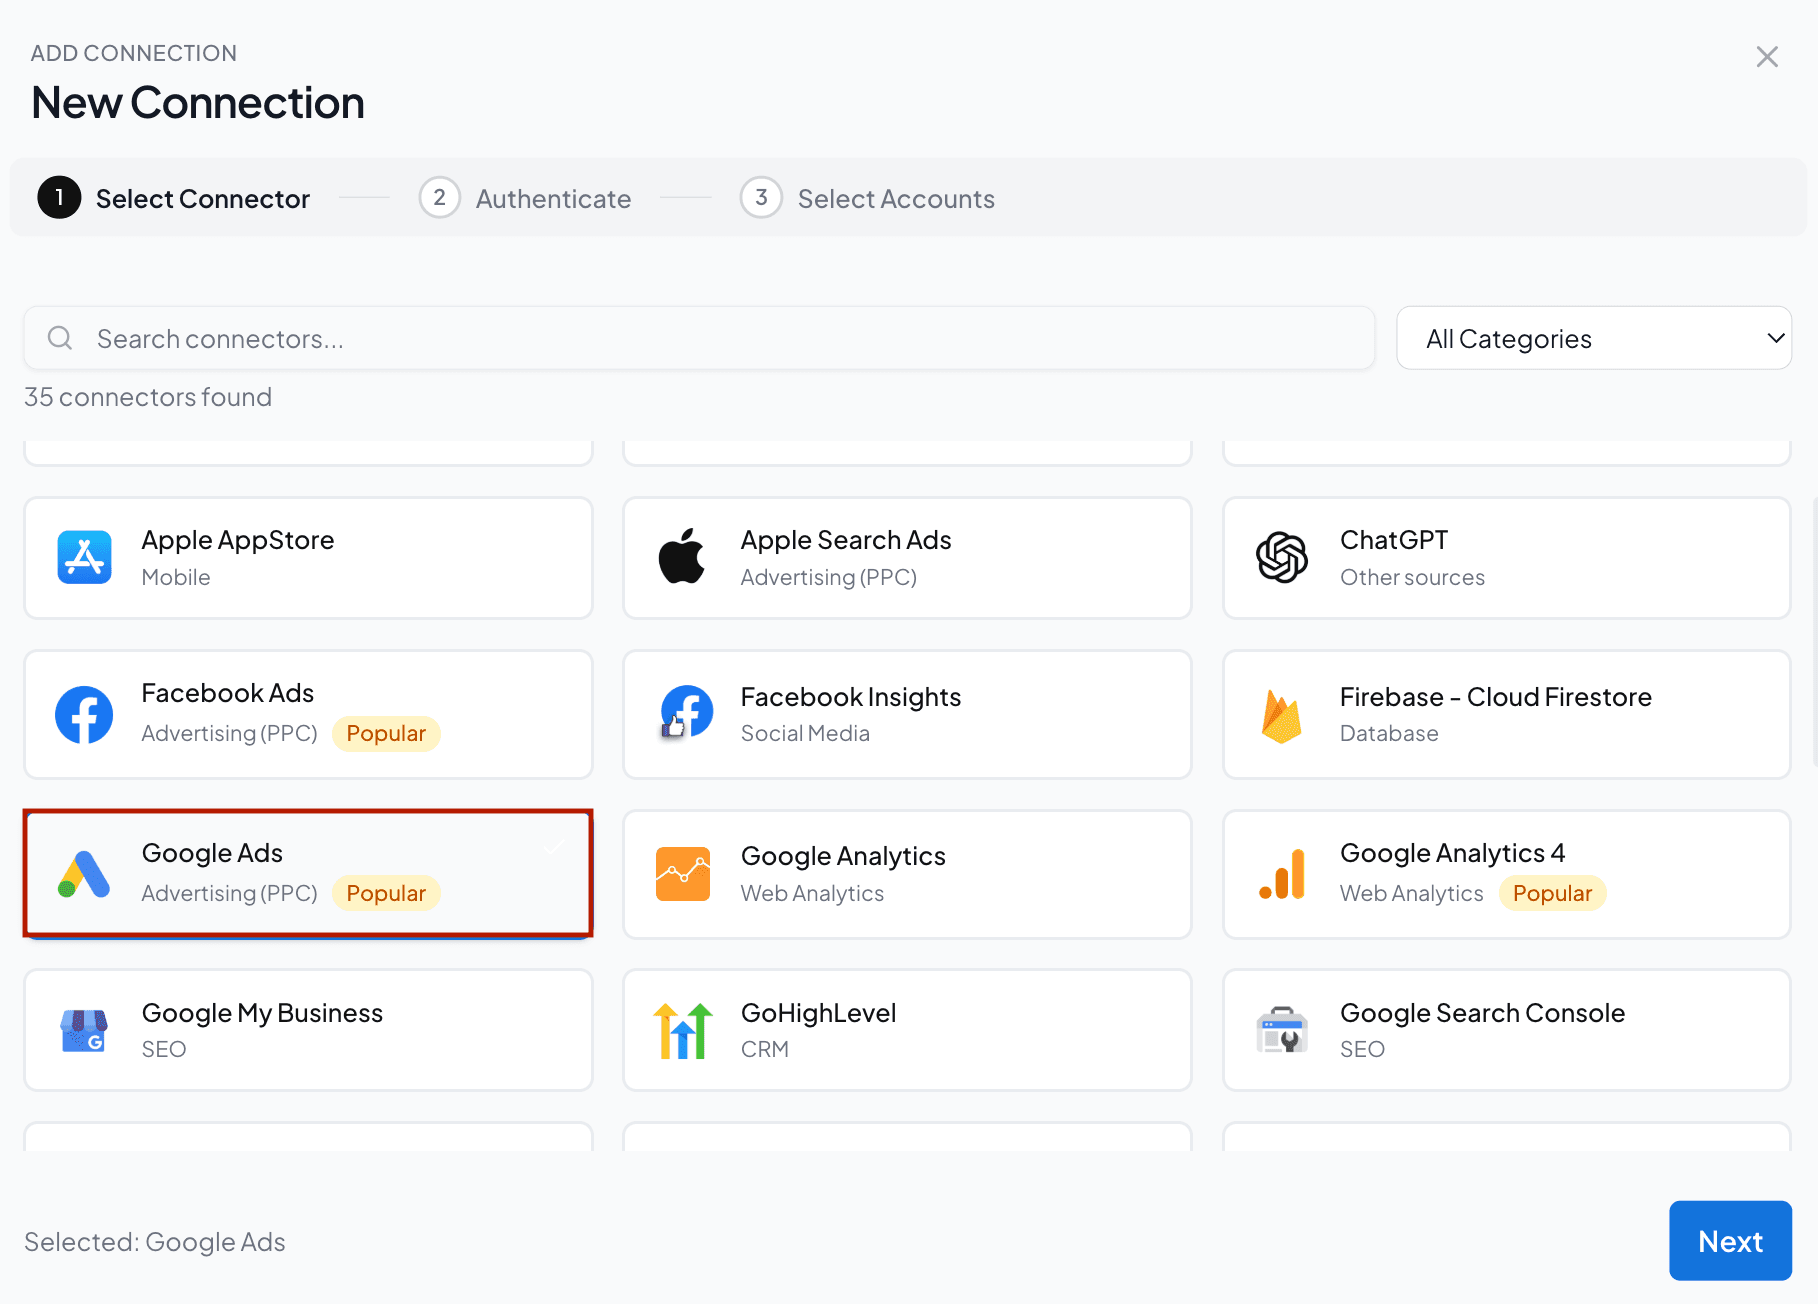
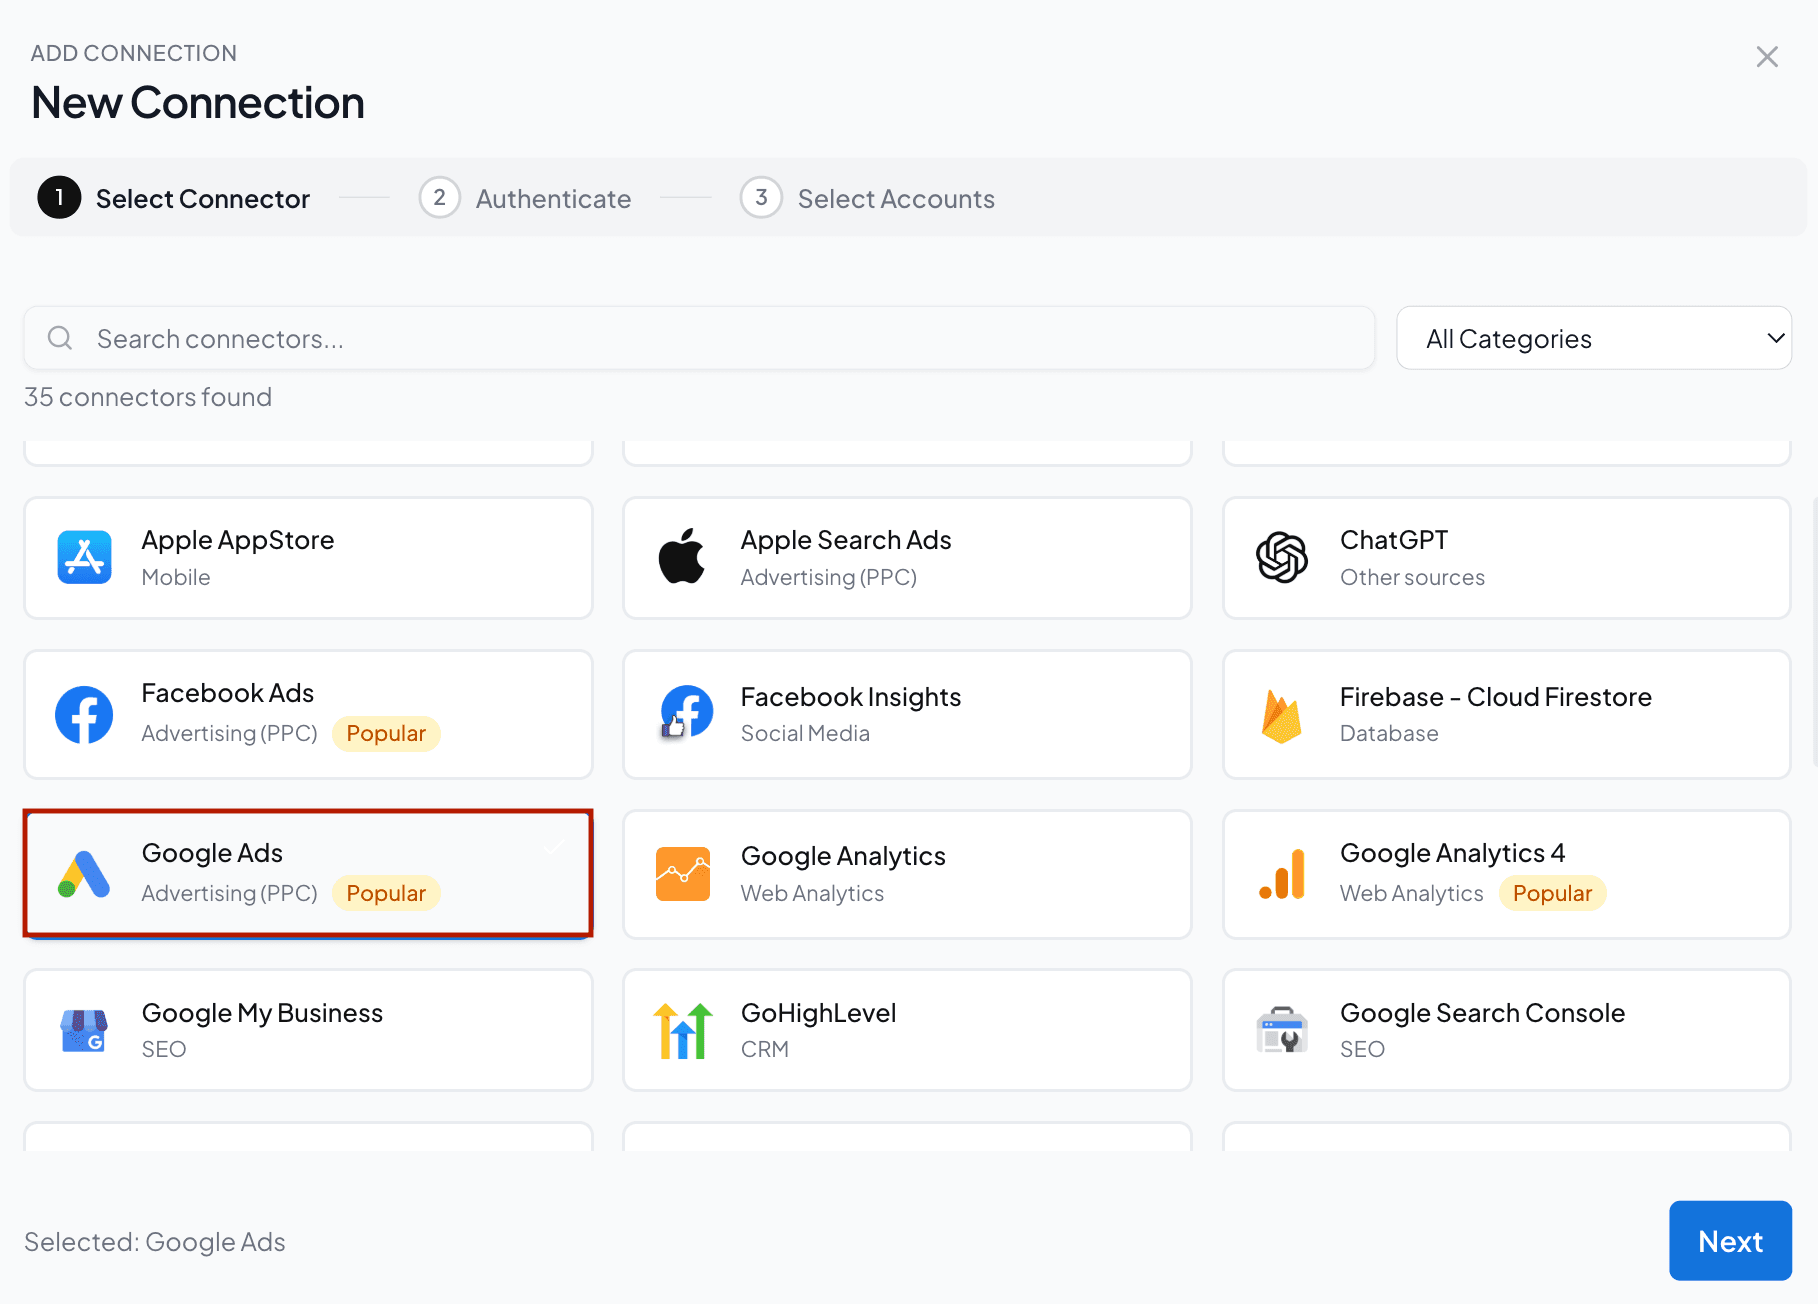
- Next, authorize the connection by entering your login credentials.
- Once authenticated, enable the Google Ads accounts you want to track and measure performance. Please note that you can’t query disabled accounts.
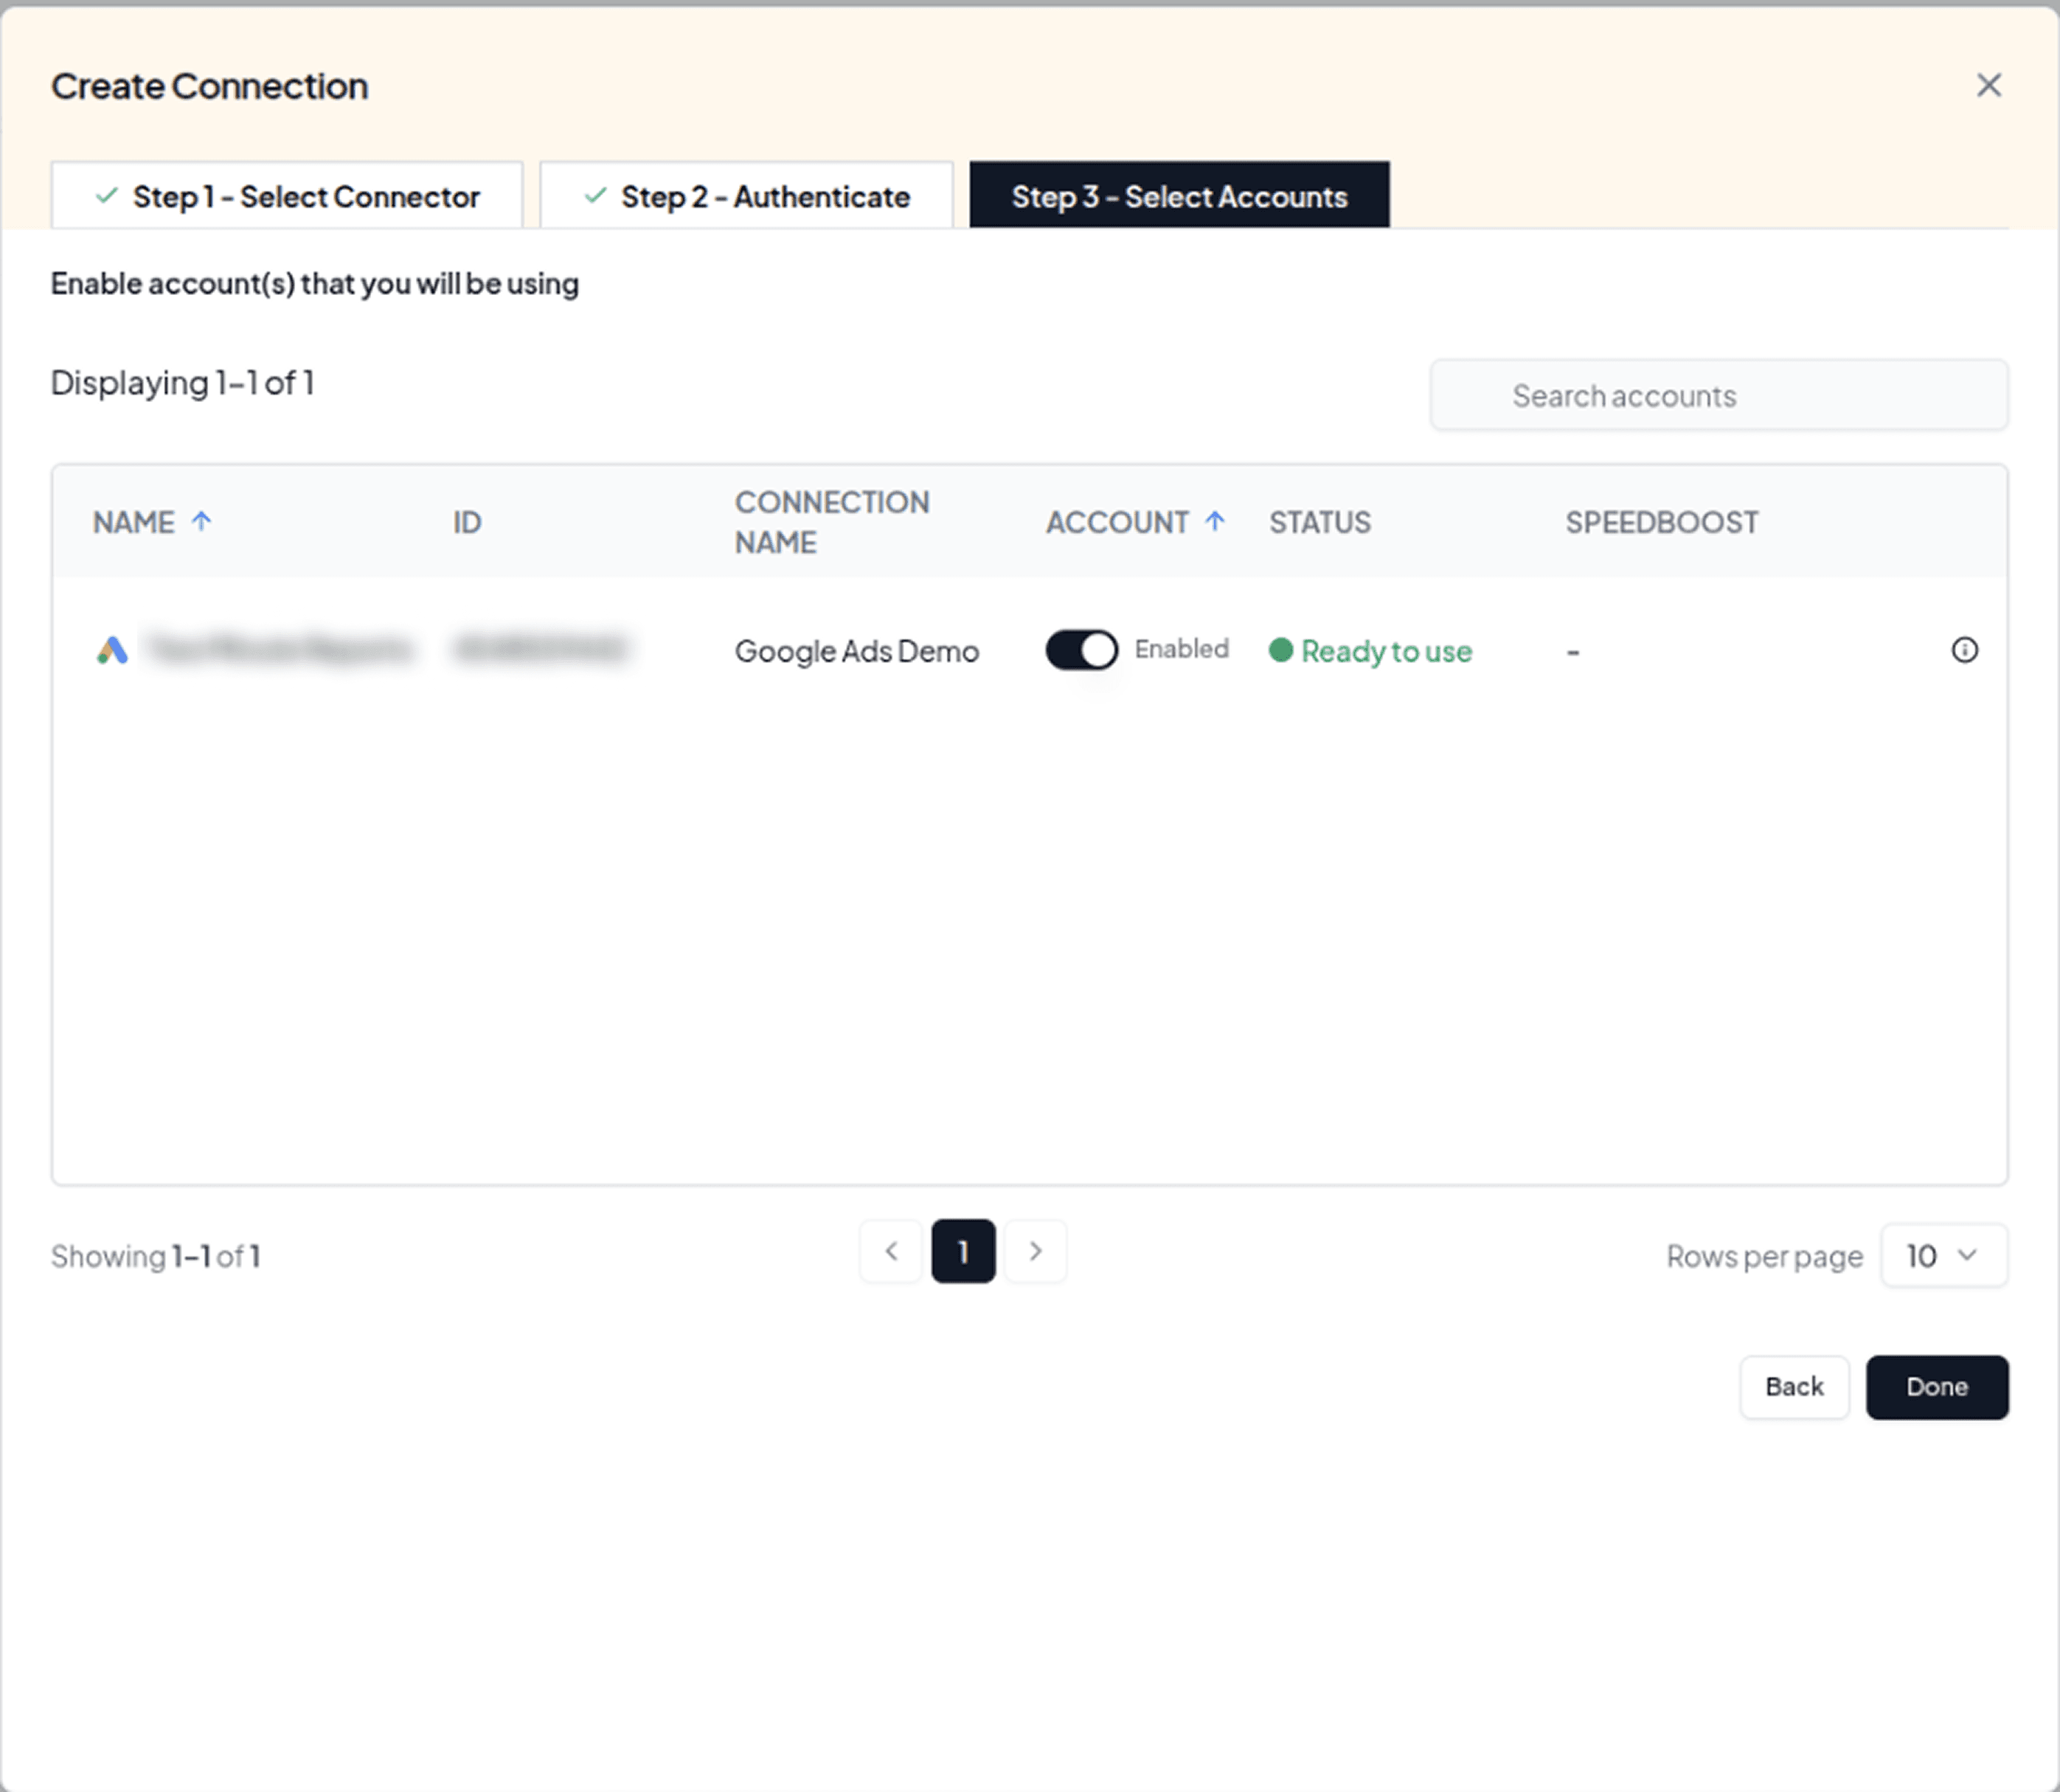
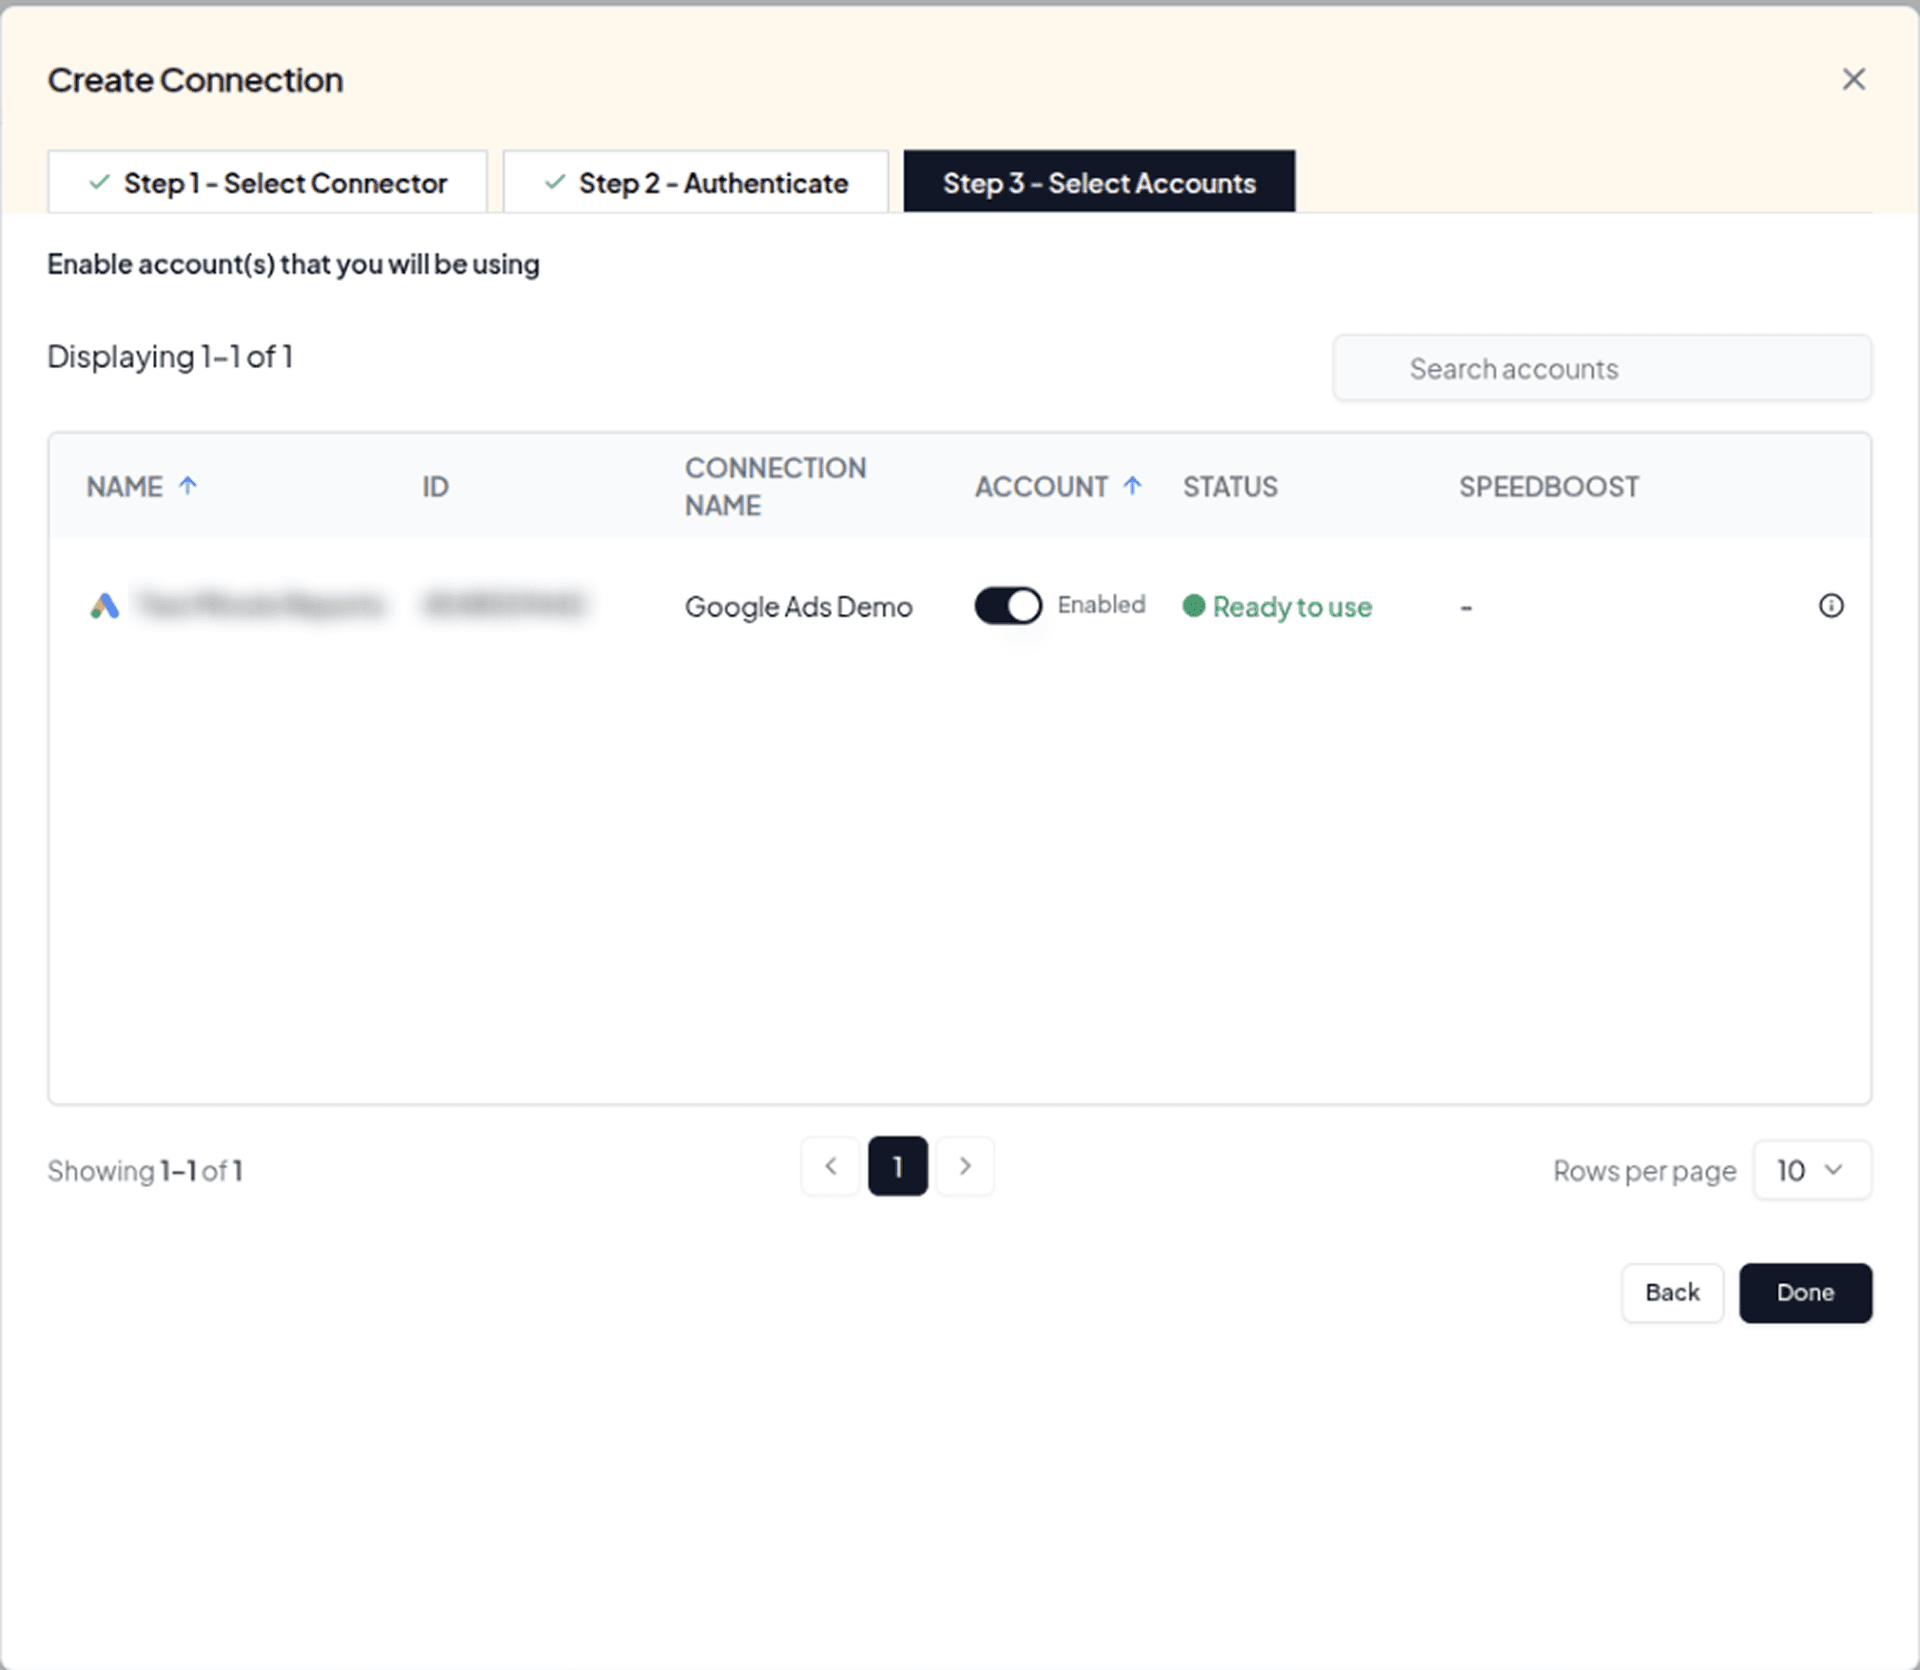
3. Once done, go back to the Hub homepage and click Google Data Studio and proceed with the steps below to build your Google Ads dashboard in Data Studio.
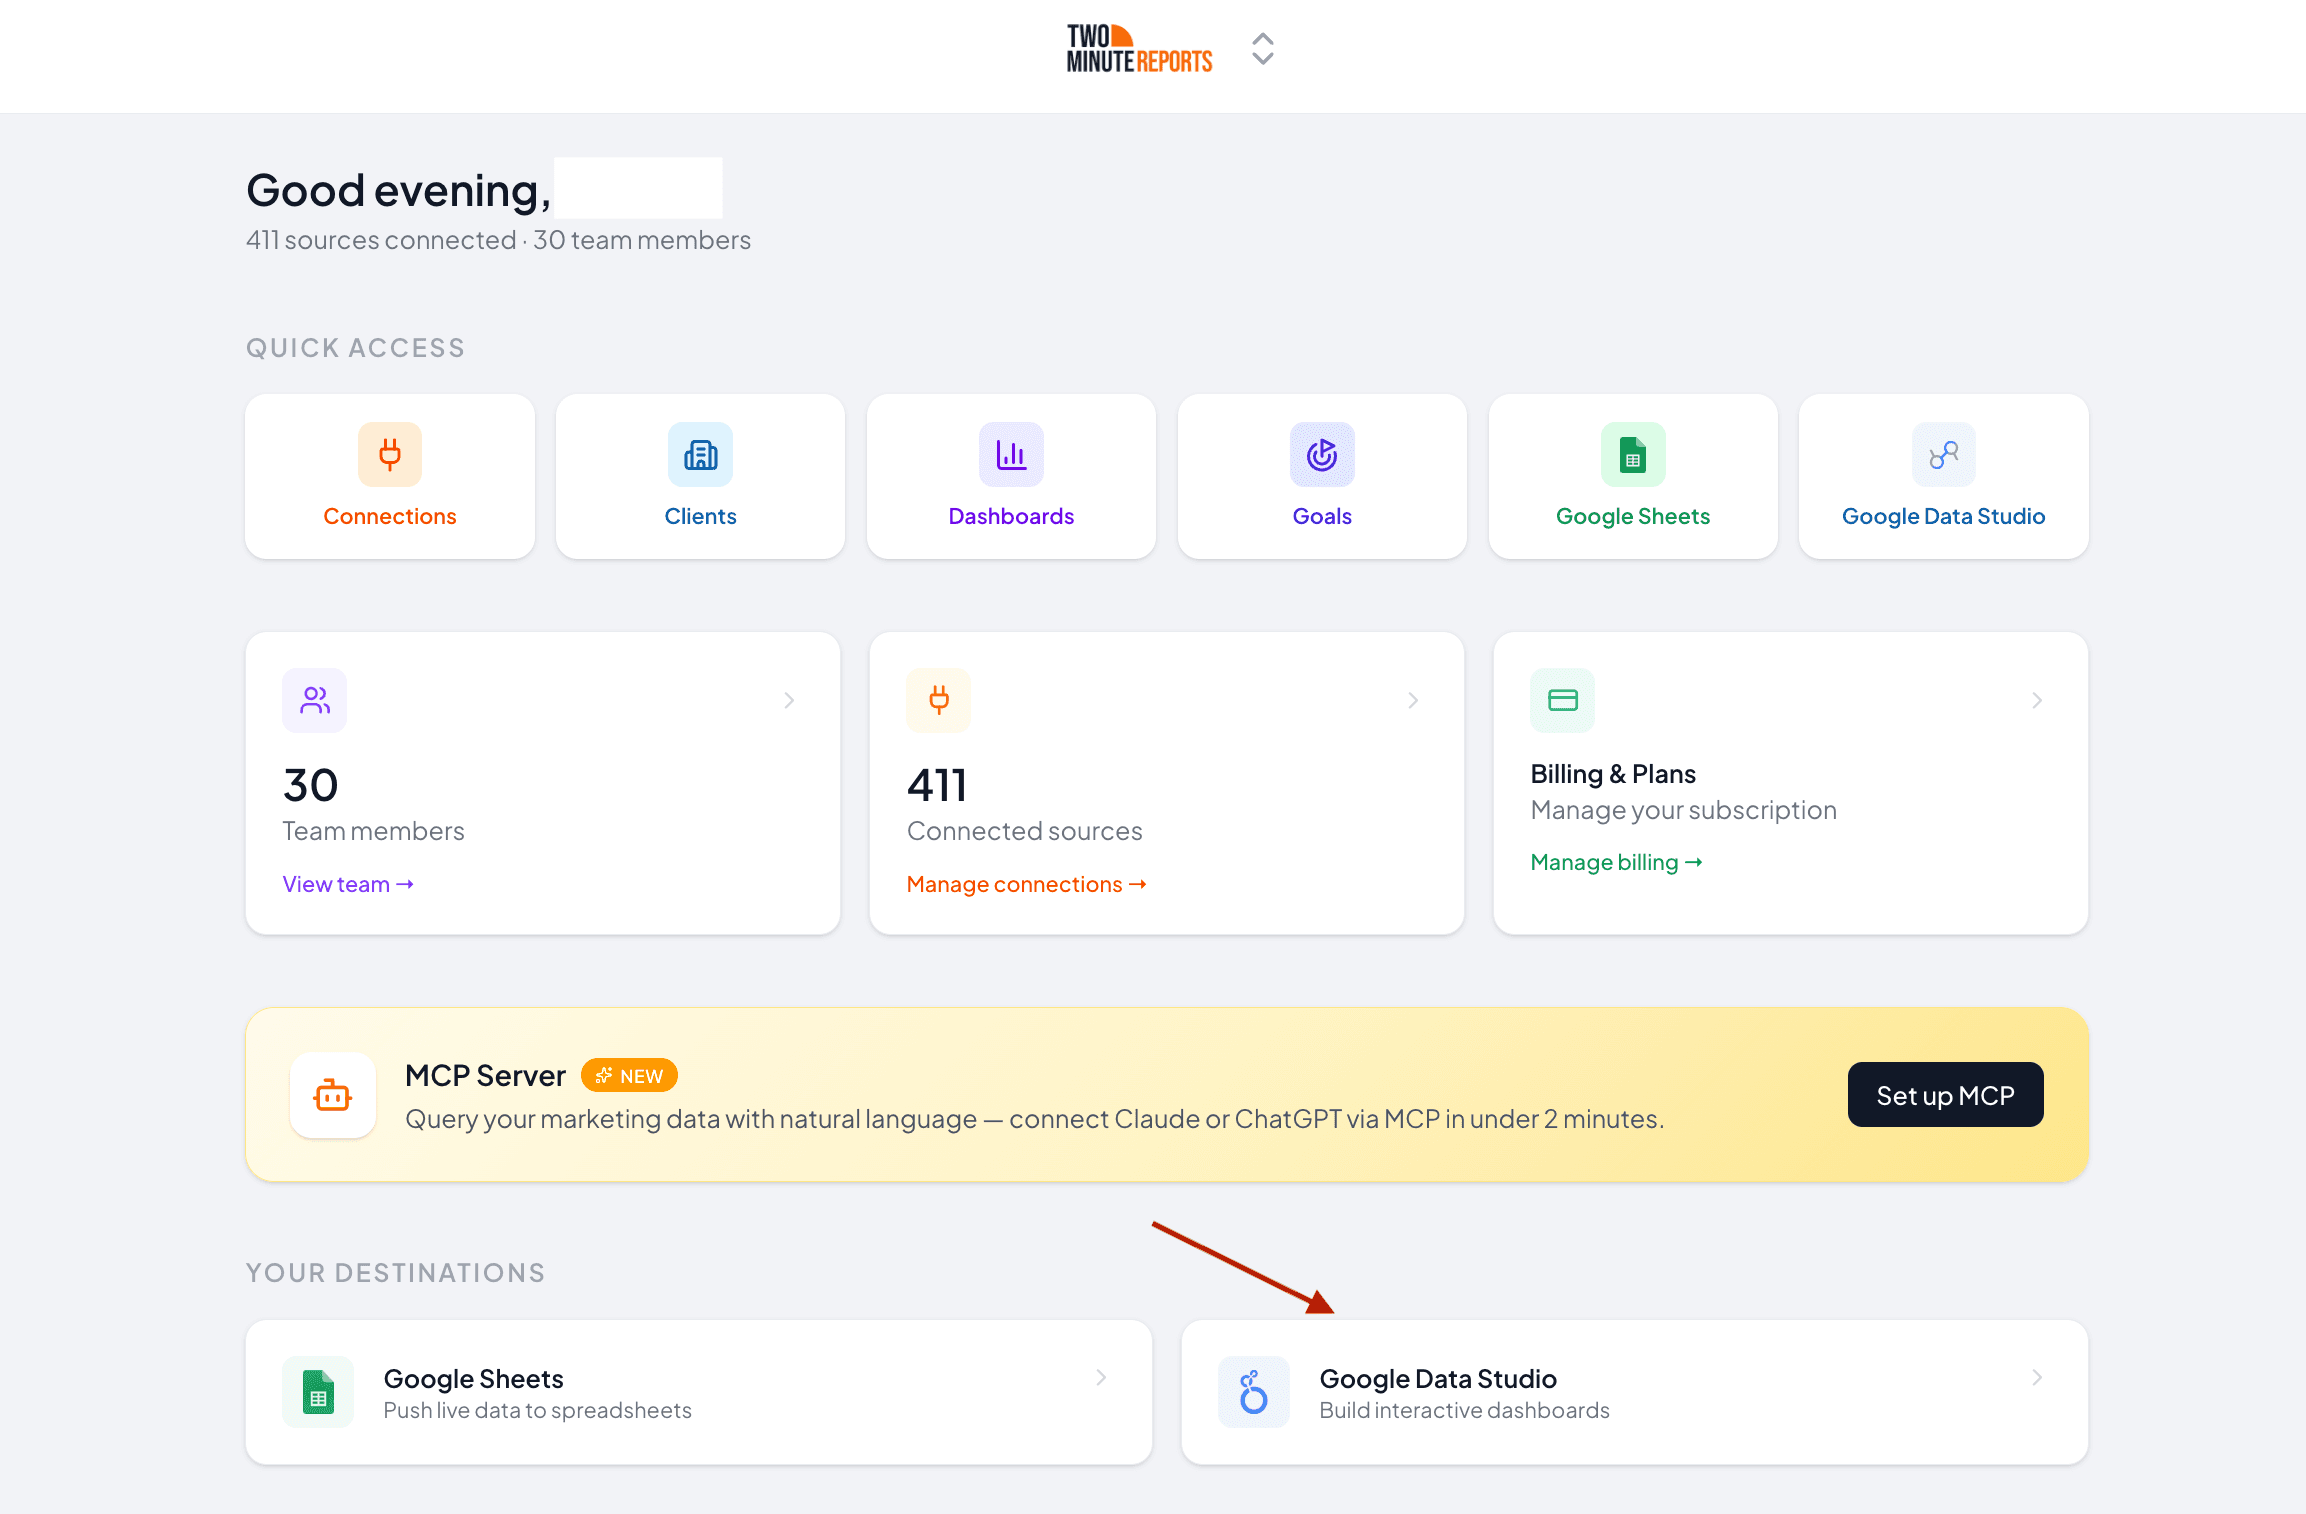
Step 2: Configure your Google Ads account in Data Studio
- Once you’re in the Google Data Studio menu, click Create Report.
- Select the Google Ads Google Data Studio connector from the options.
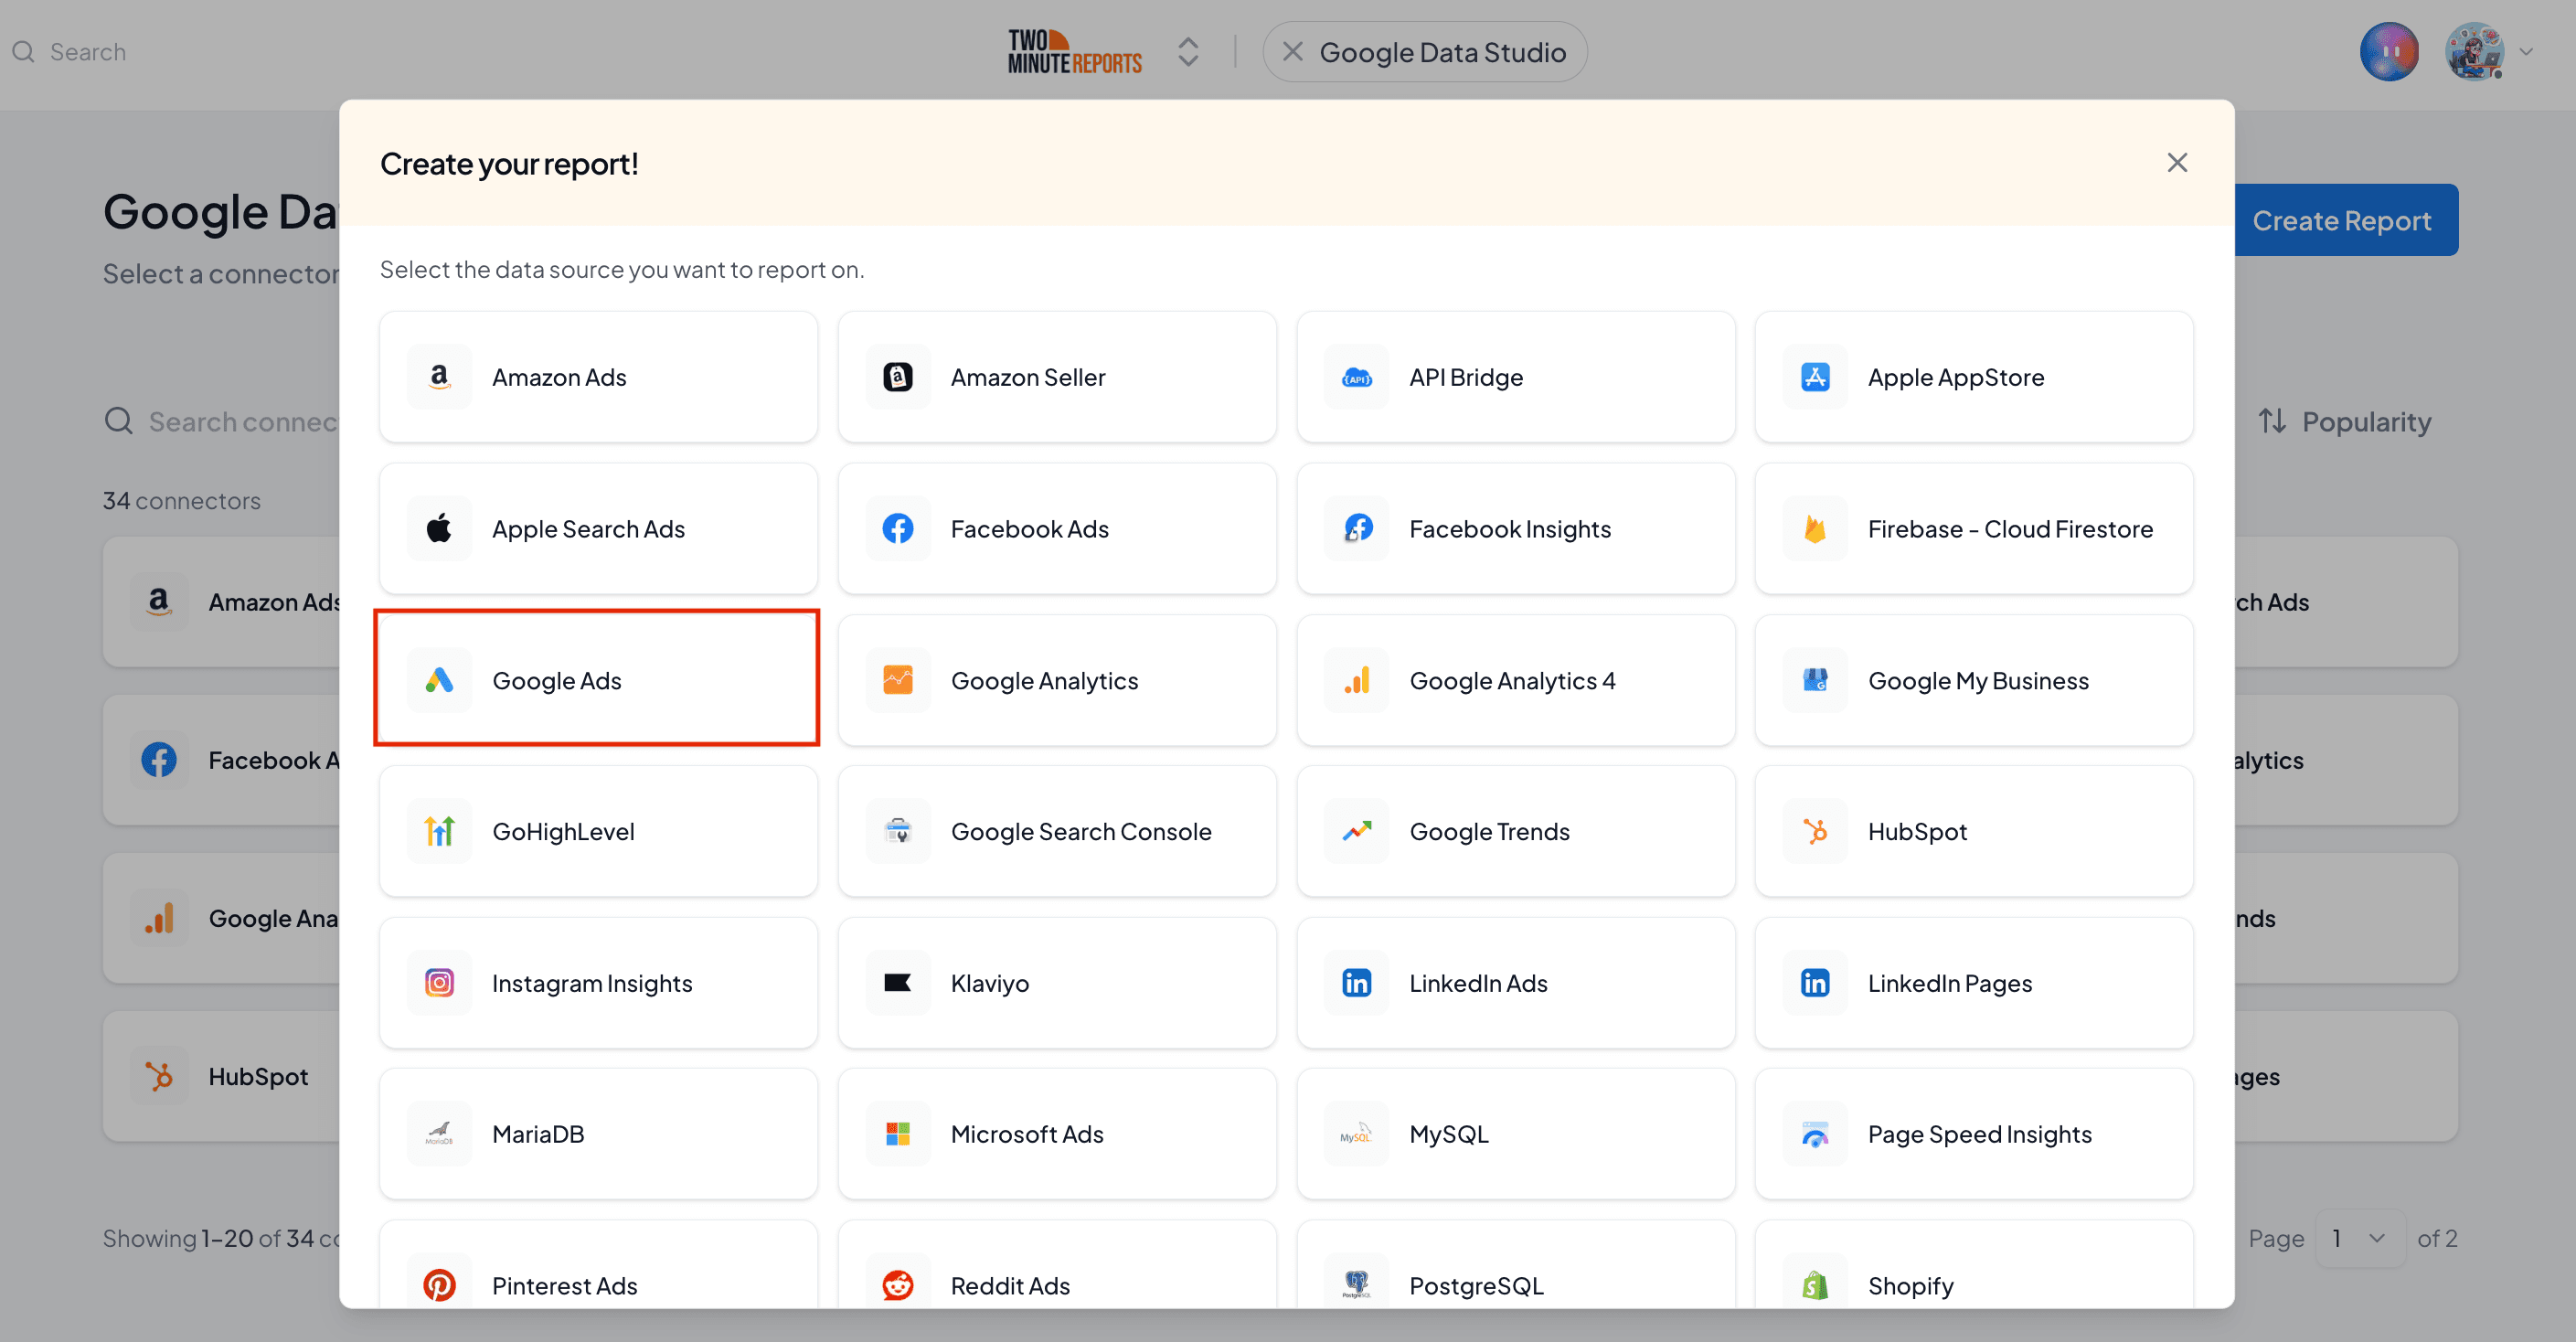
- In Step 2 (Choose Query Config dropdown), click +Create new query config.
Query Config lets you group multiple accounts, making it easier to access centralised insights in your Data Studio dashboard.
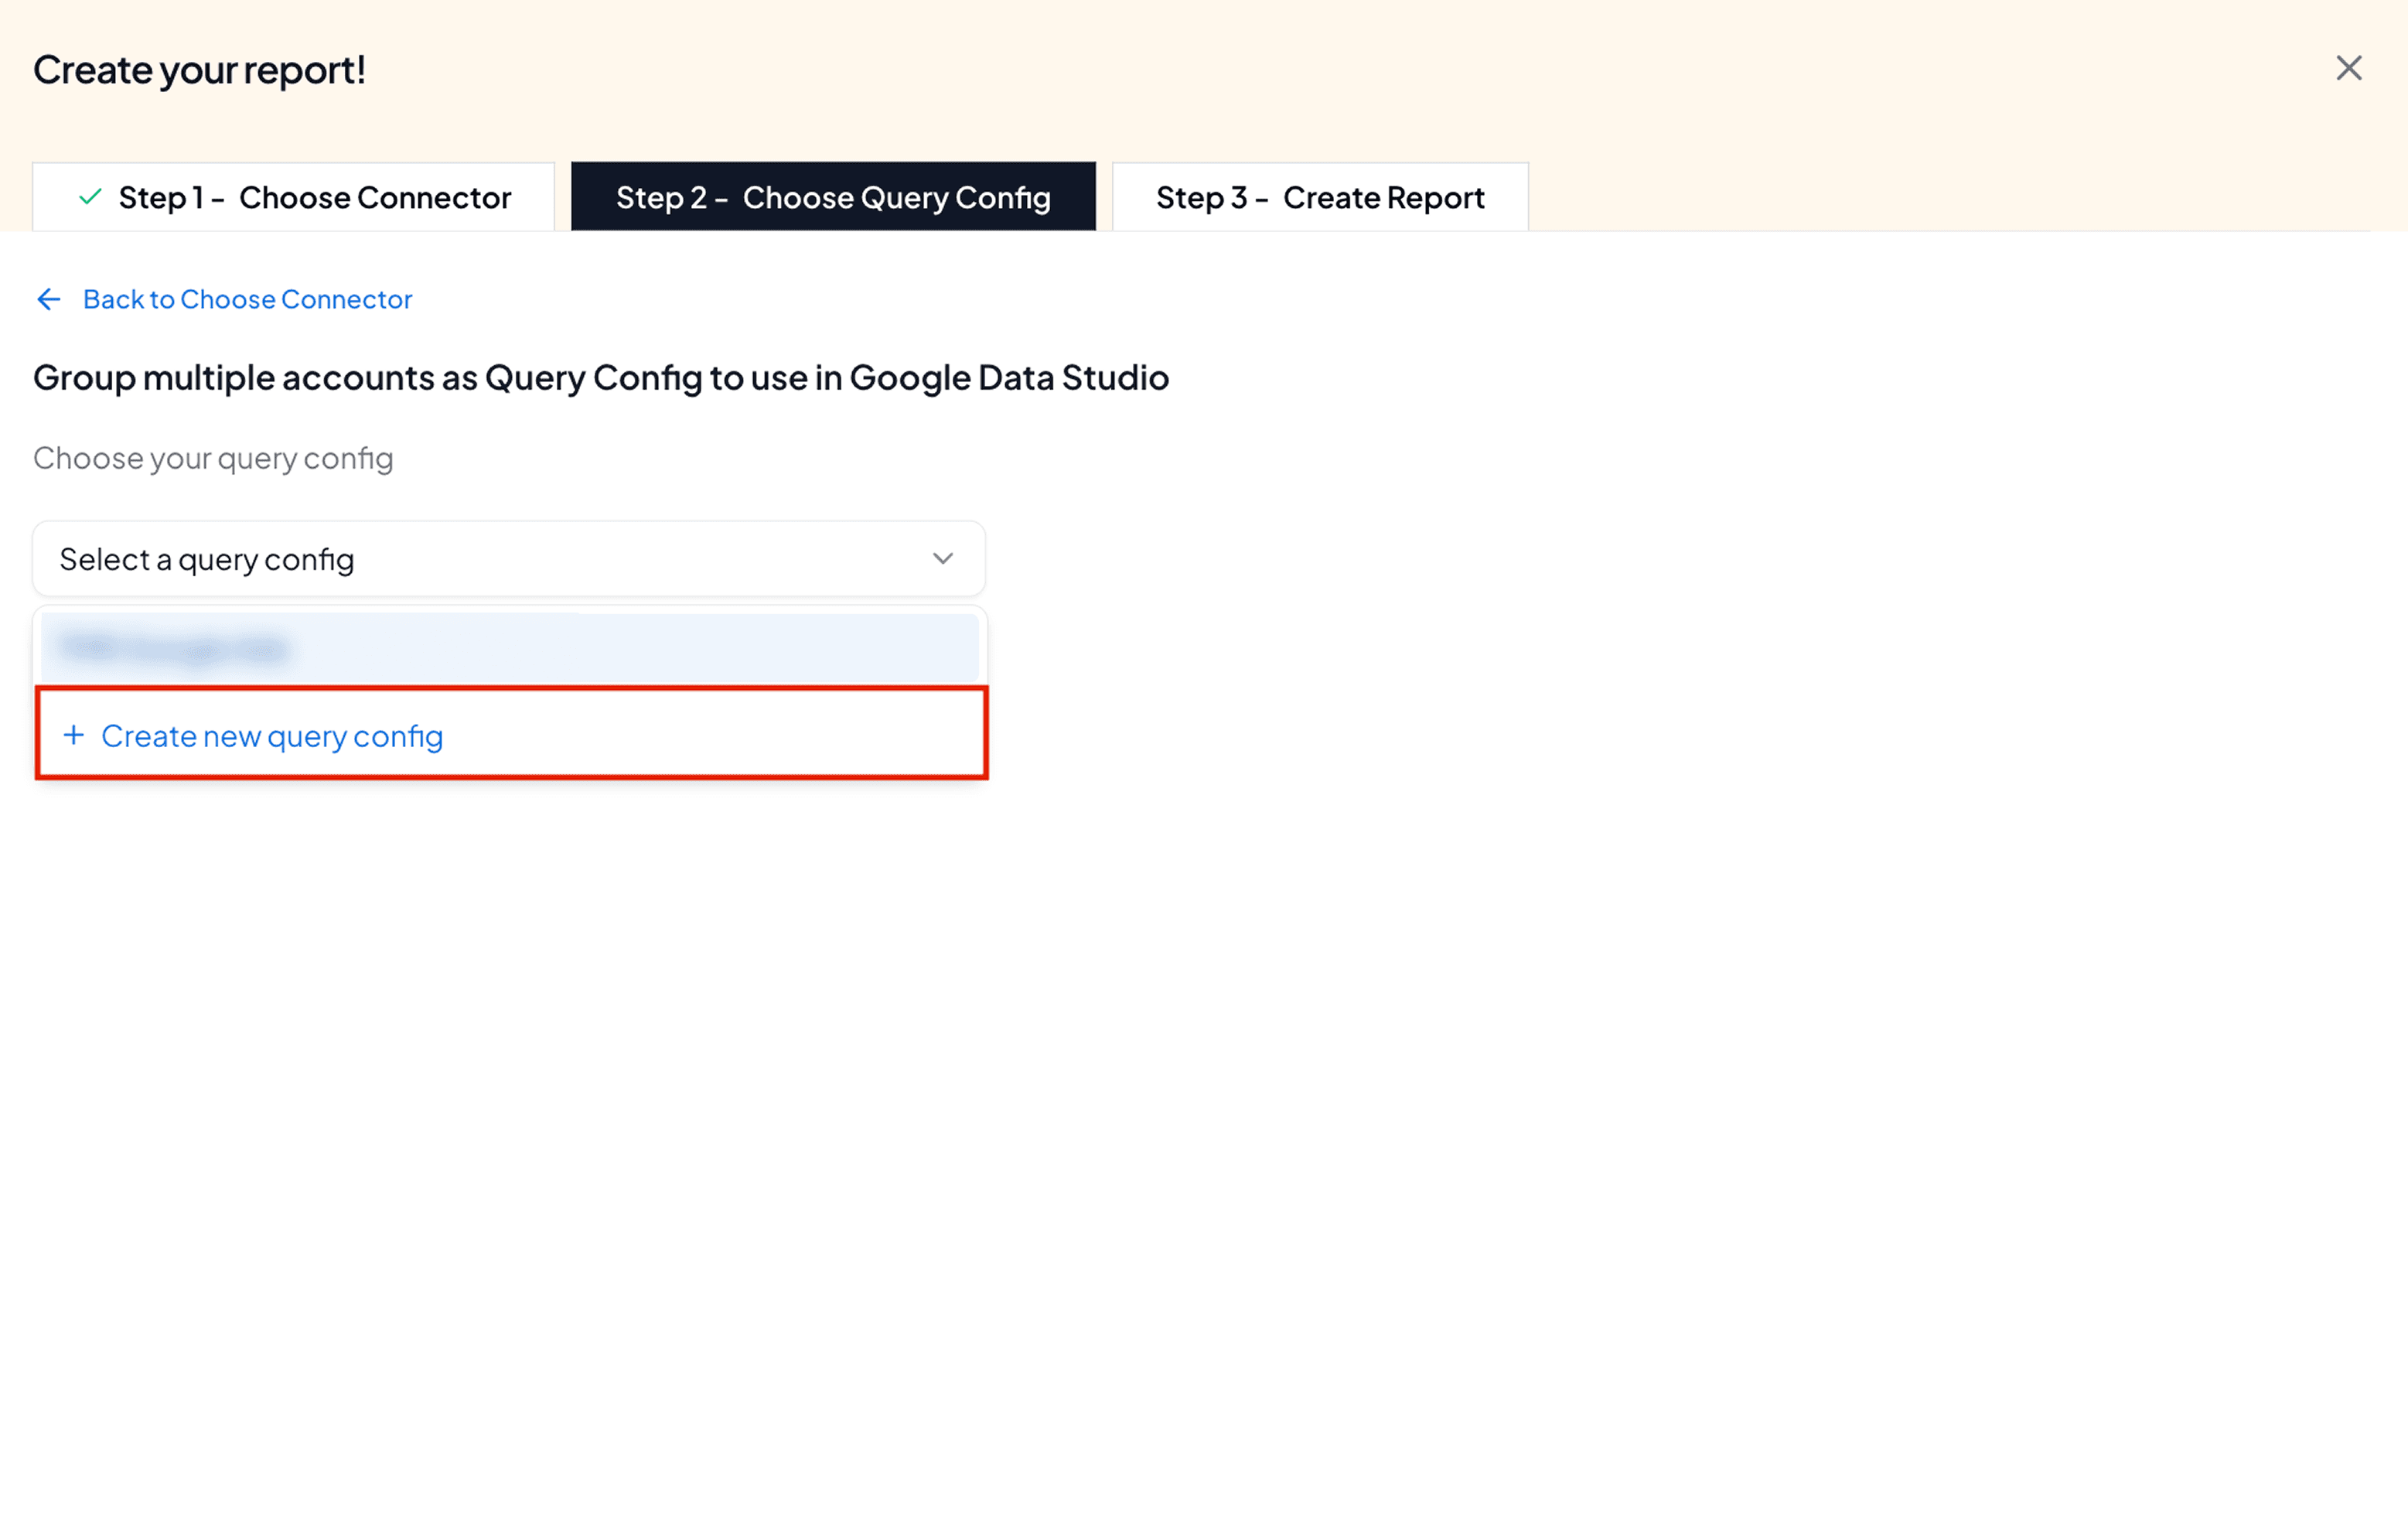
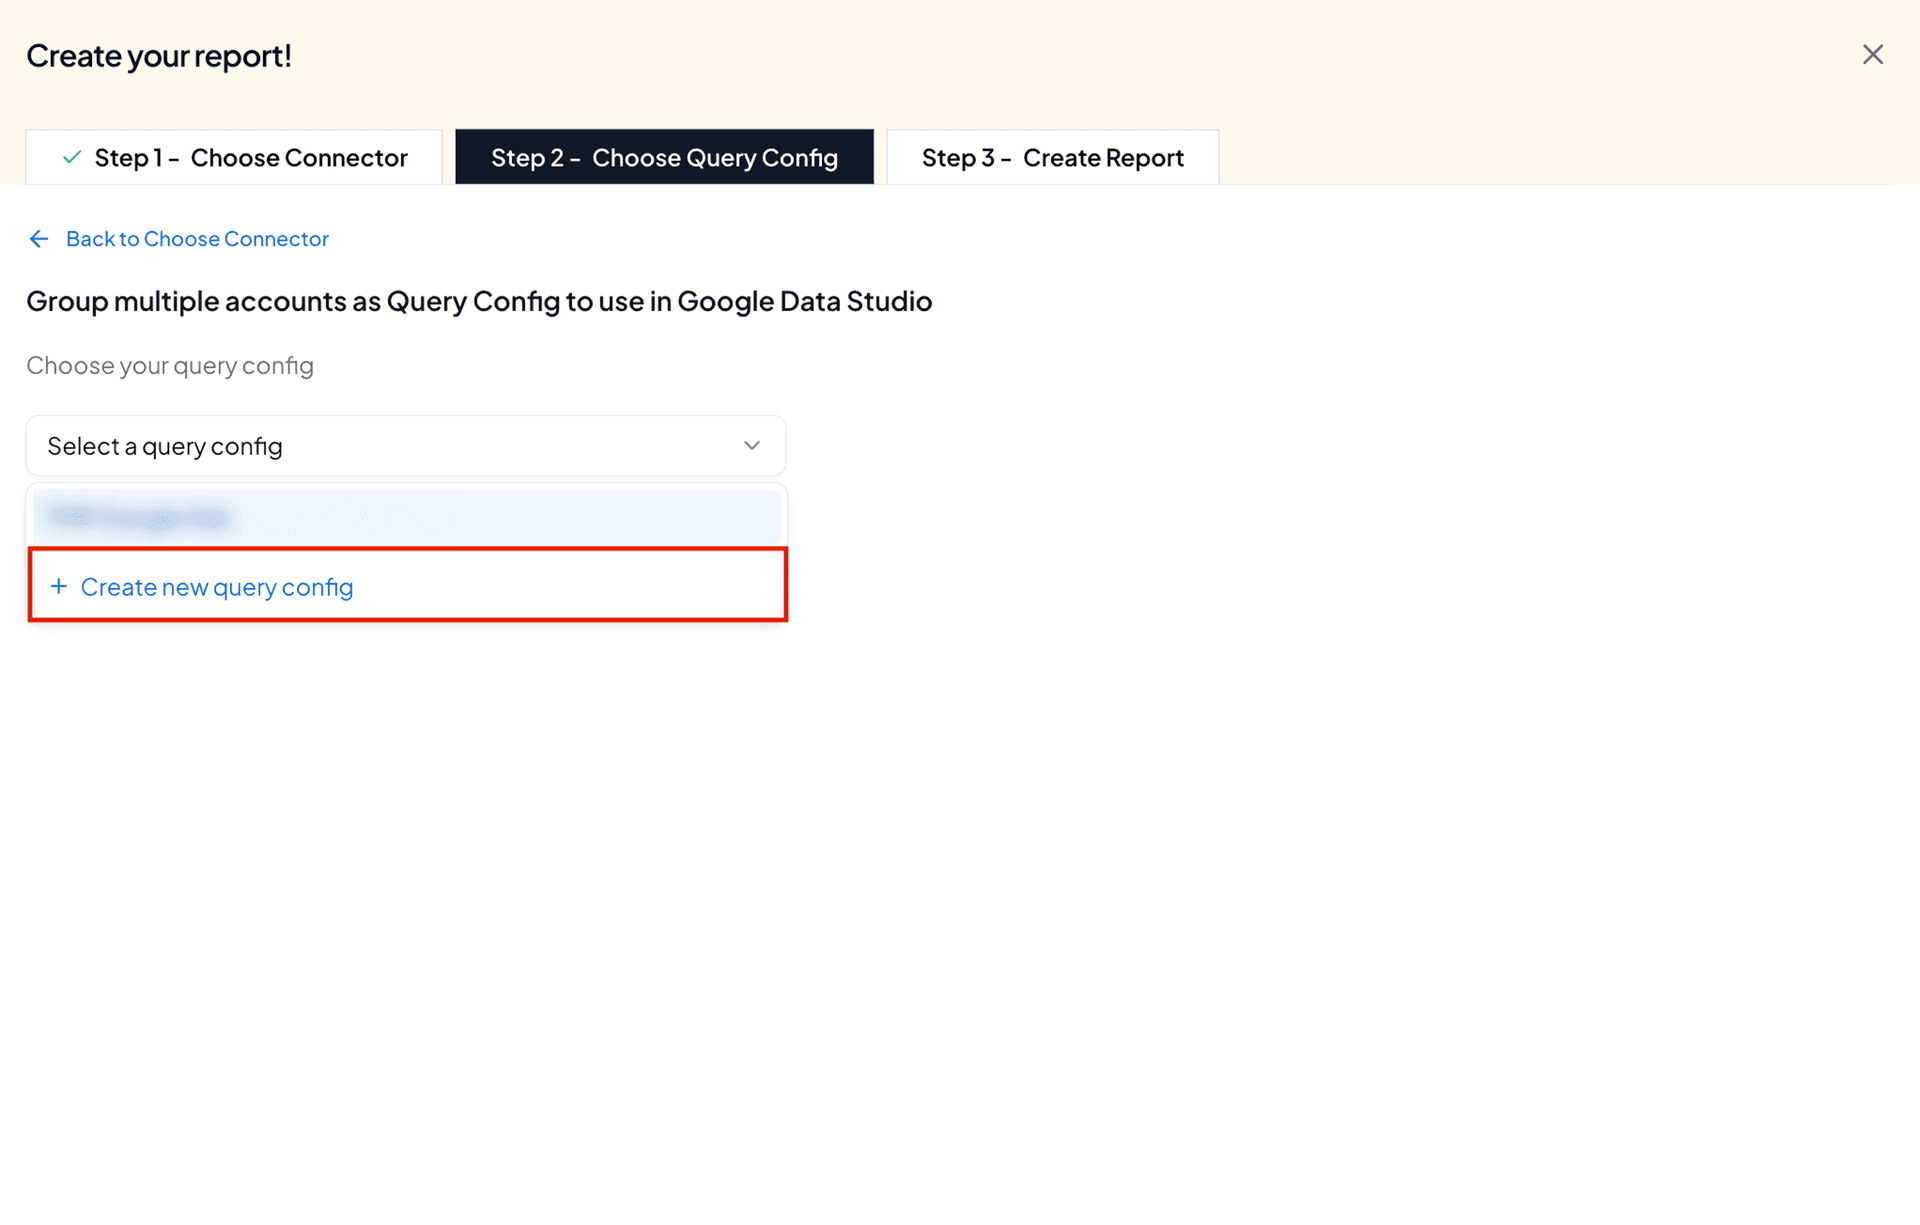
- Once you click Create New Query Config, you can specify the name of your Query Config and select the required Google Ads accounts to connect to Google Data Studio. Click Save.
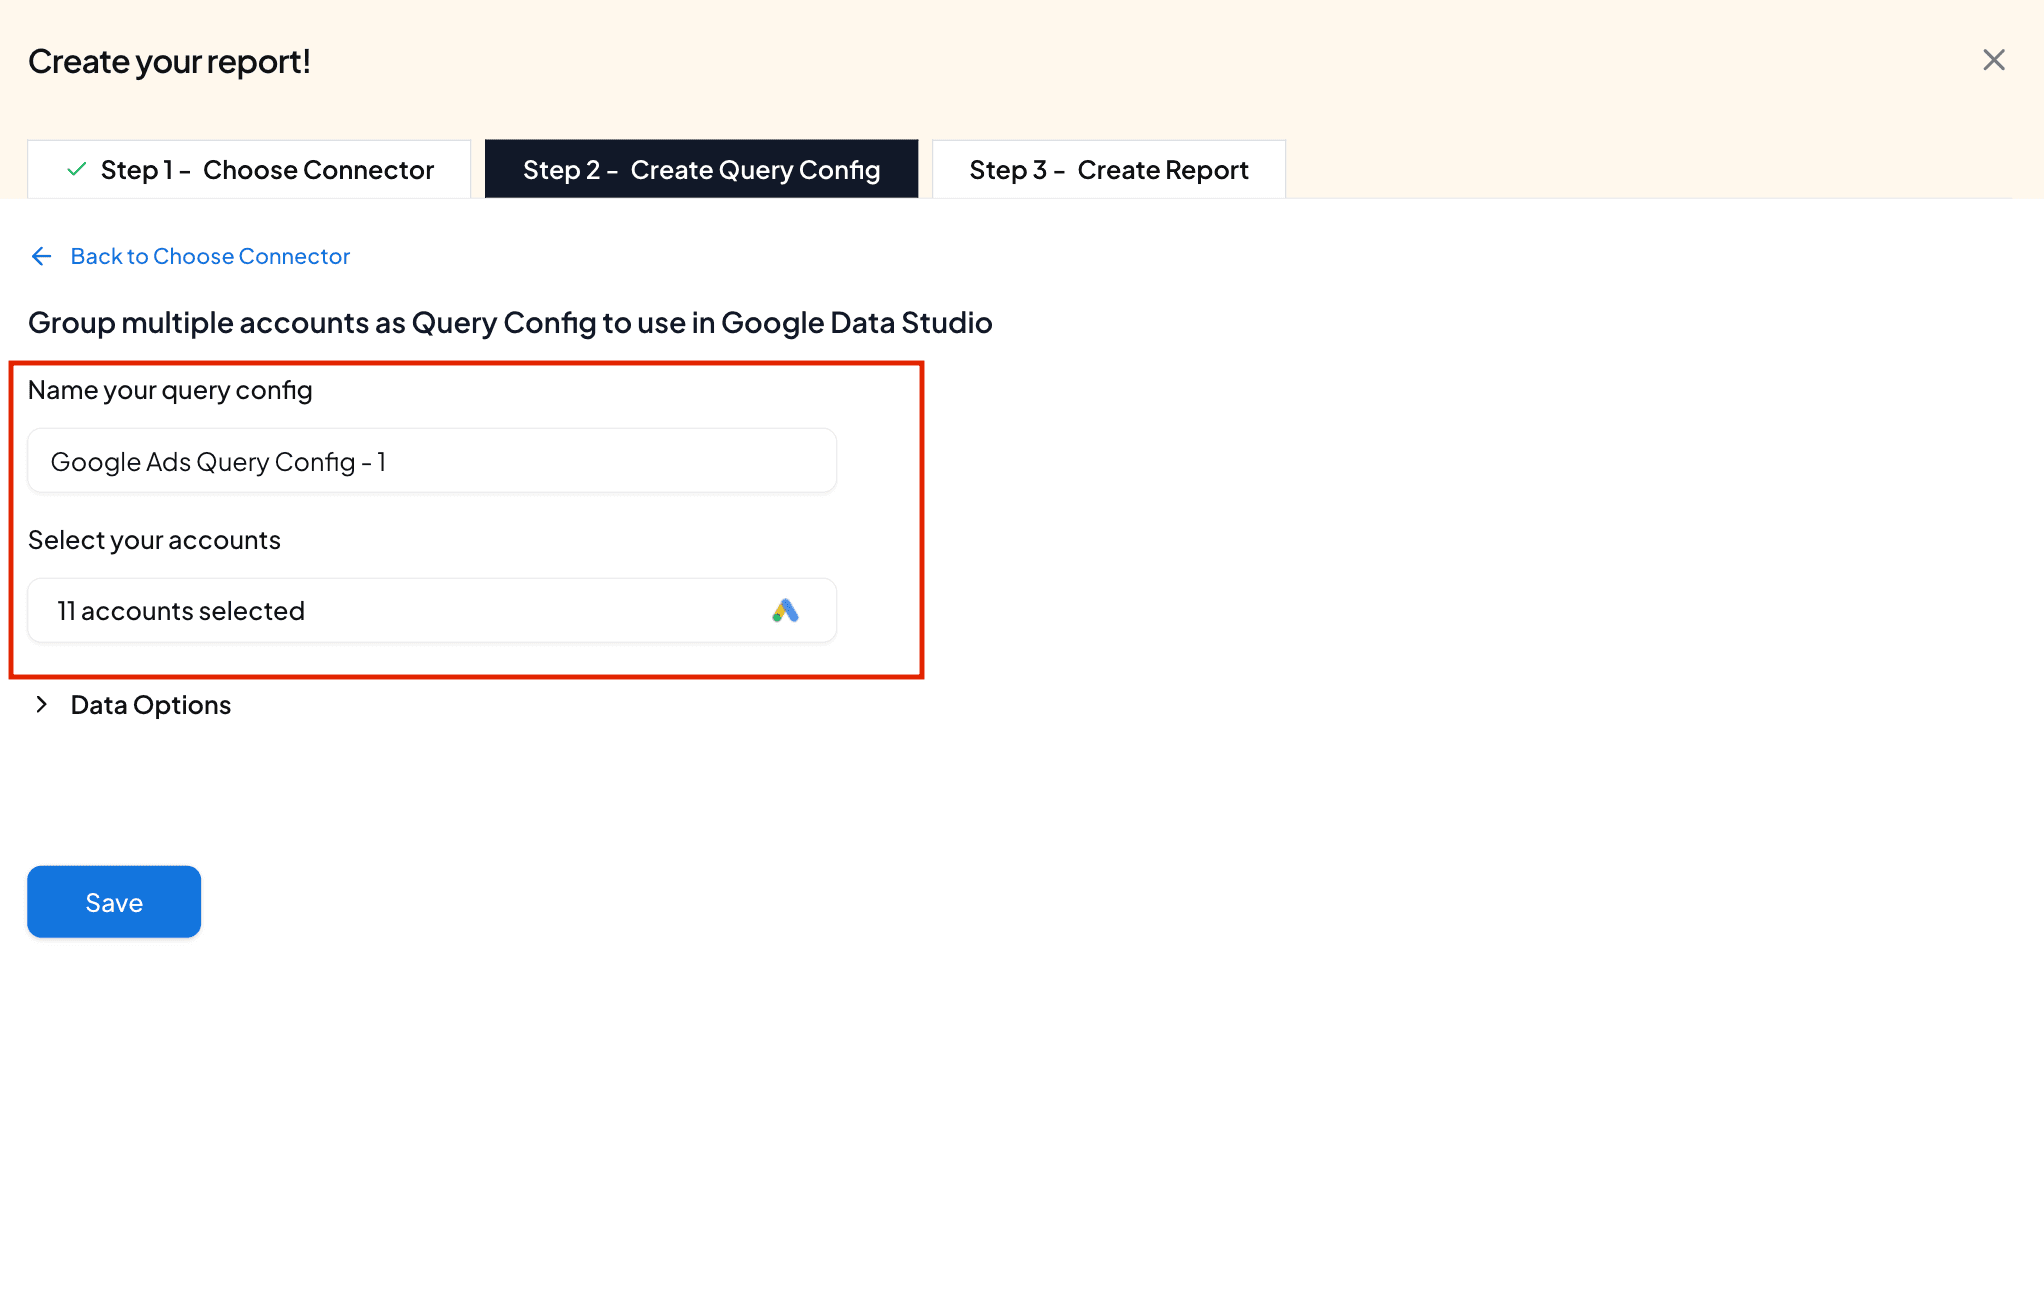
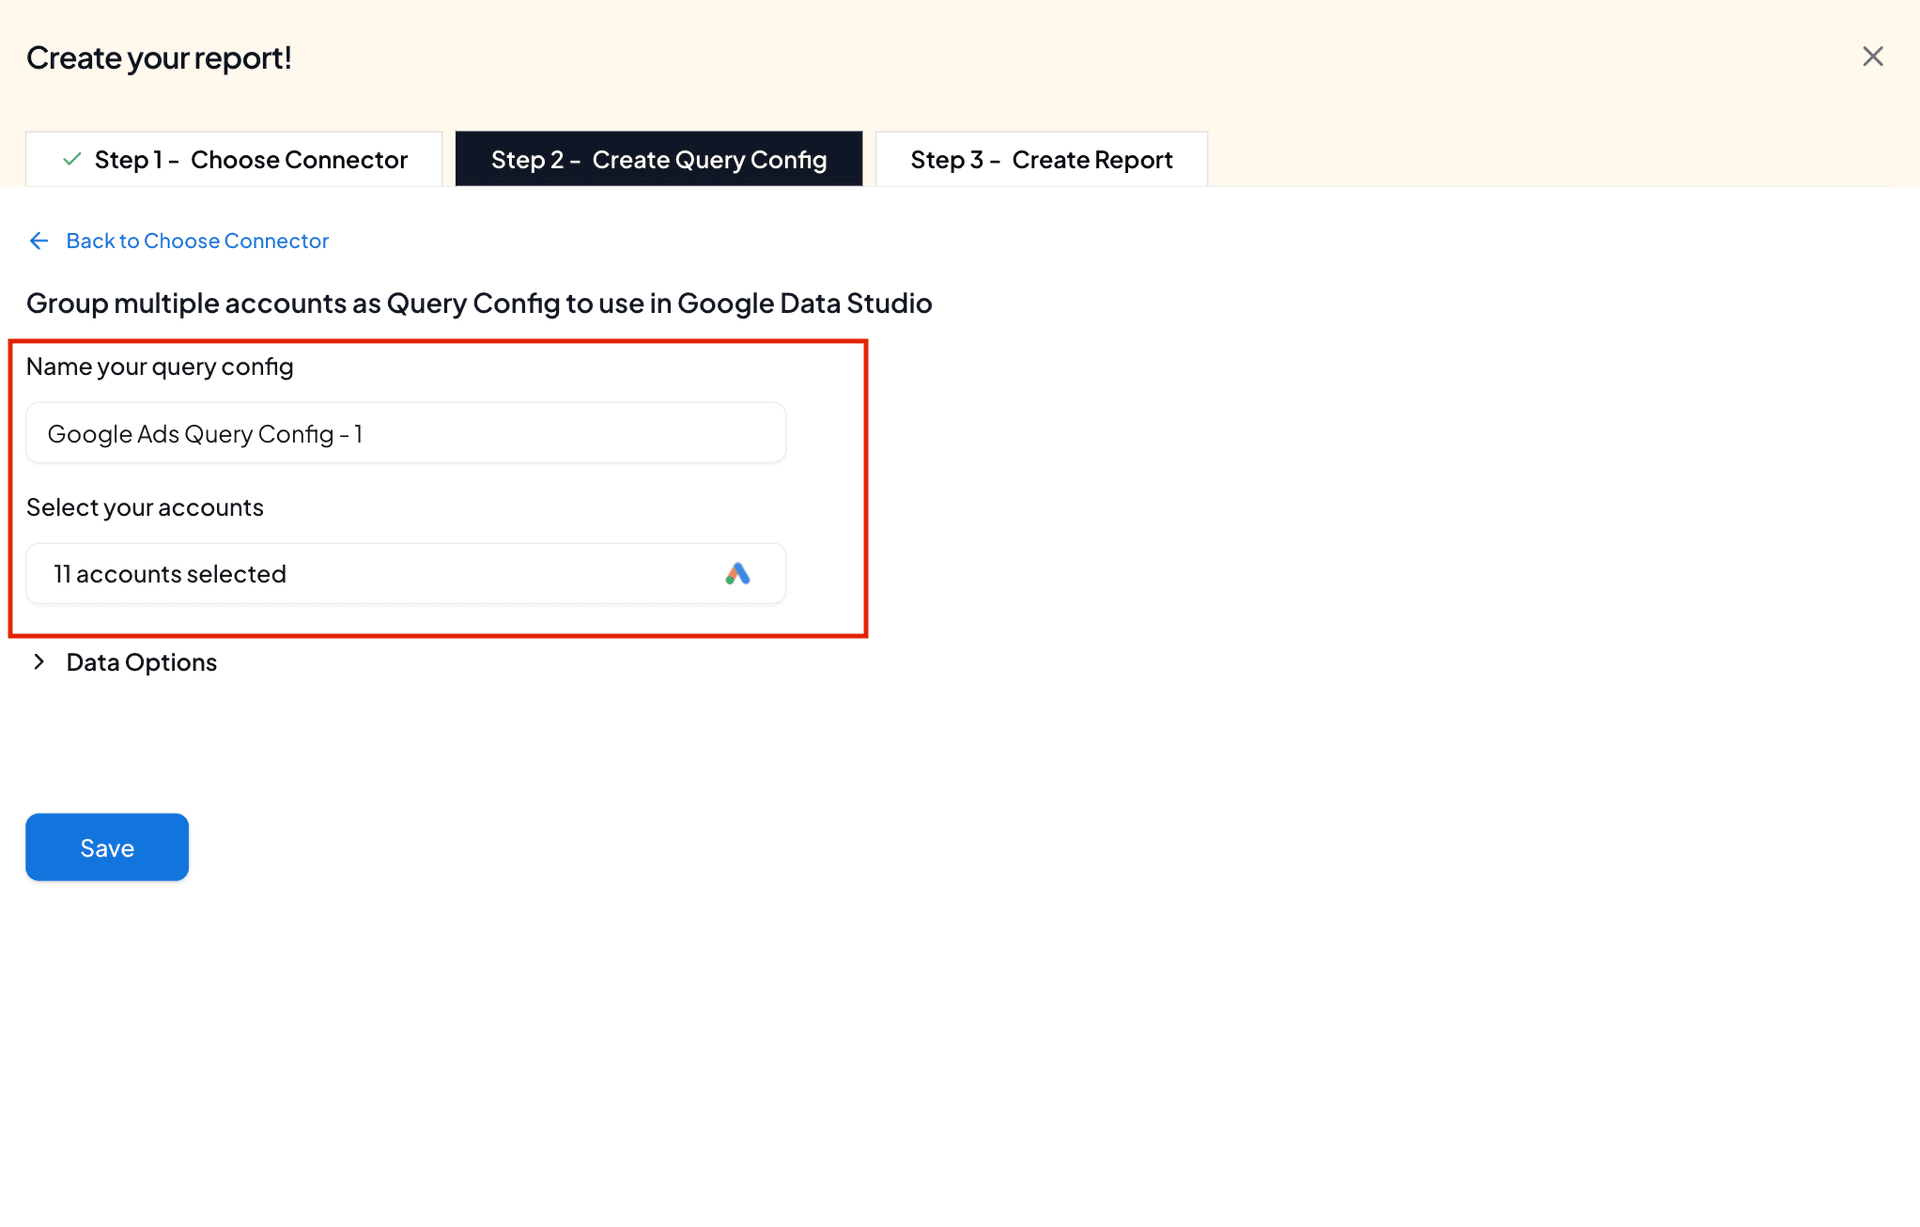
- Then, click Create from scratch to build your Google Ads dashboard in Data Studio.
Step 3: Build Your Google Ads Dashboard in Data Studio
- Now you’ll land on the Data Studio dashboard.
- Select your team and your Query Config (Google Ads Query Config – 1). Click Connect to continue.
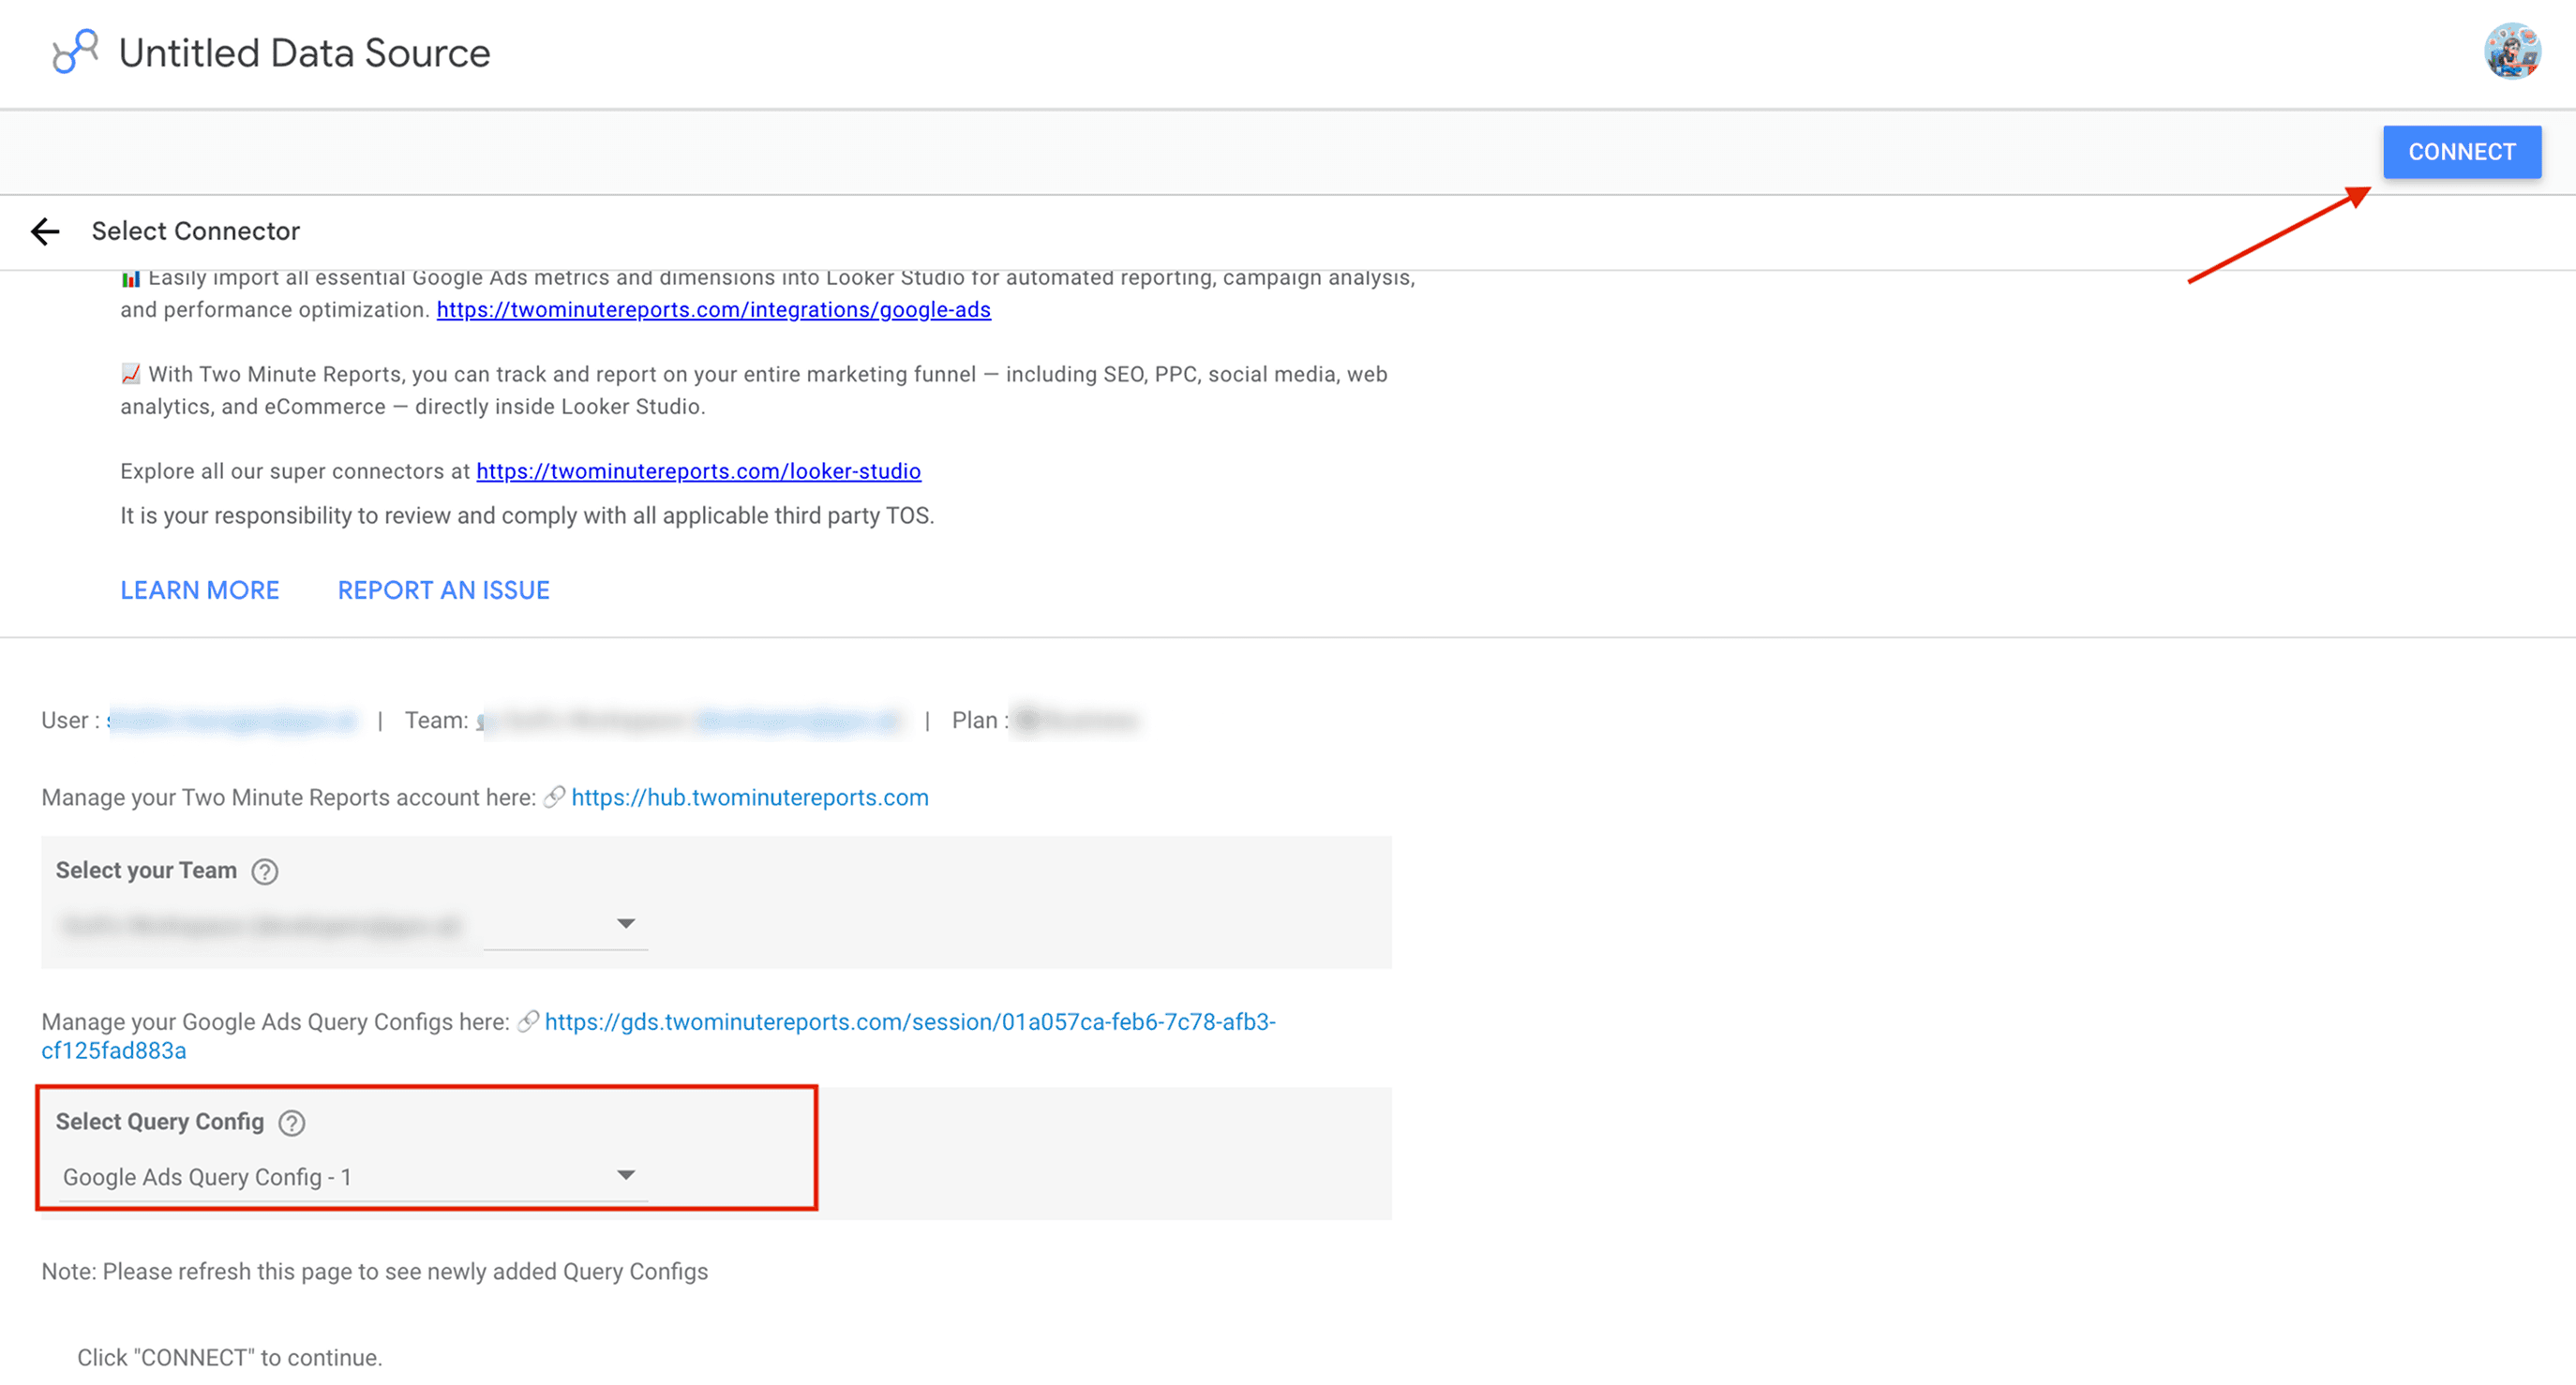
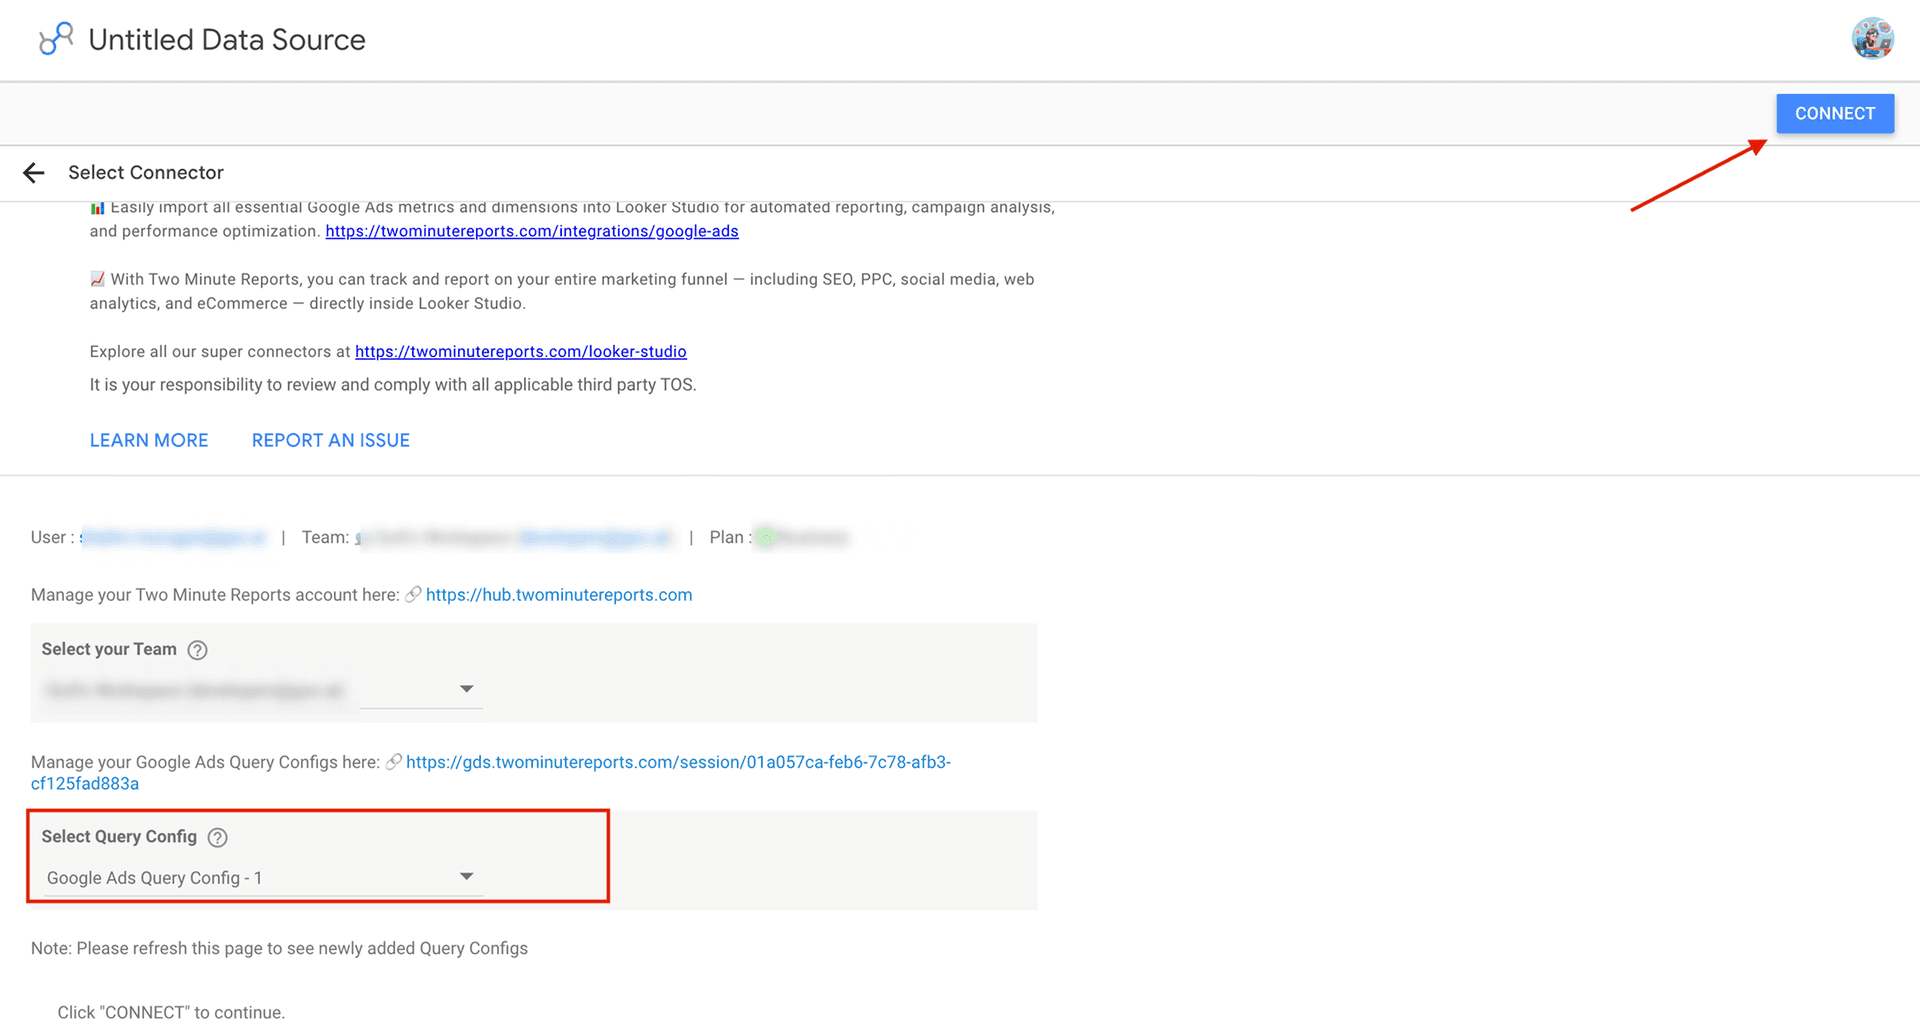
- Review the Google Ads metrics and dimensions to be included and click Create Report.
- Now, you can add relevant charts, drag and drop metrics, include filters, date ranges and dimensions to customize your Google Ads dashboard in Google Data Studio.
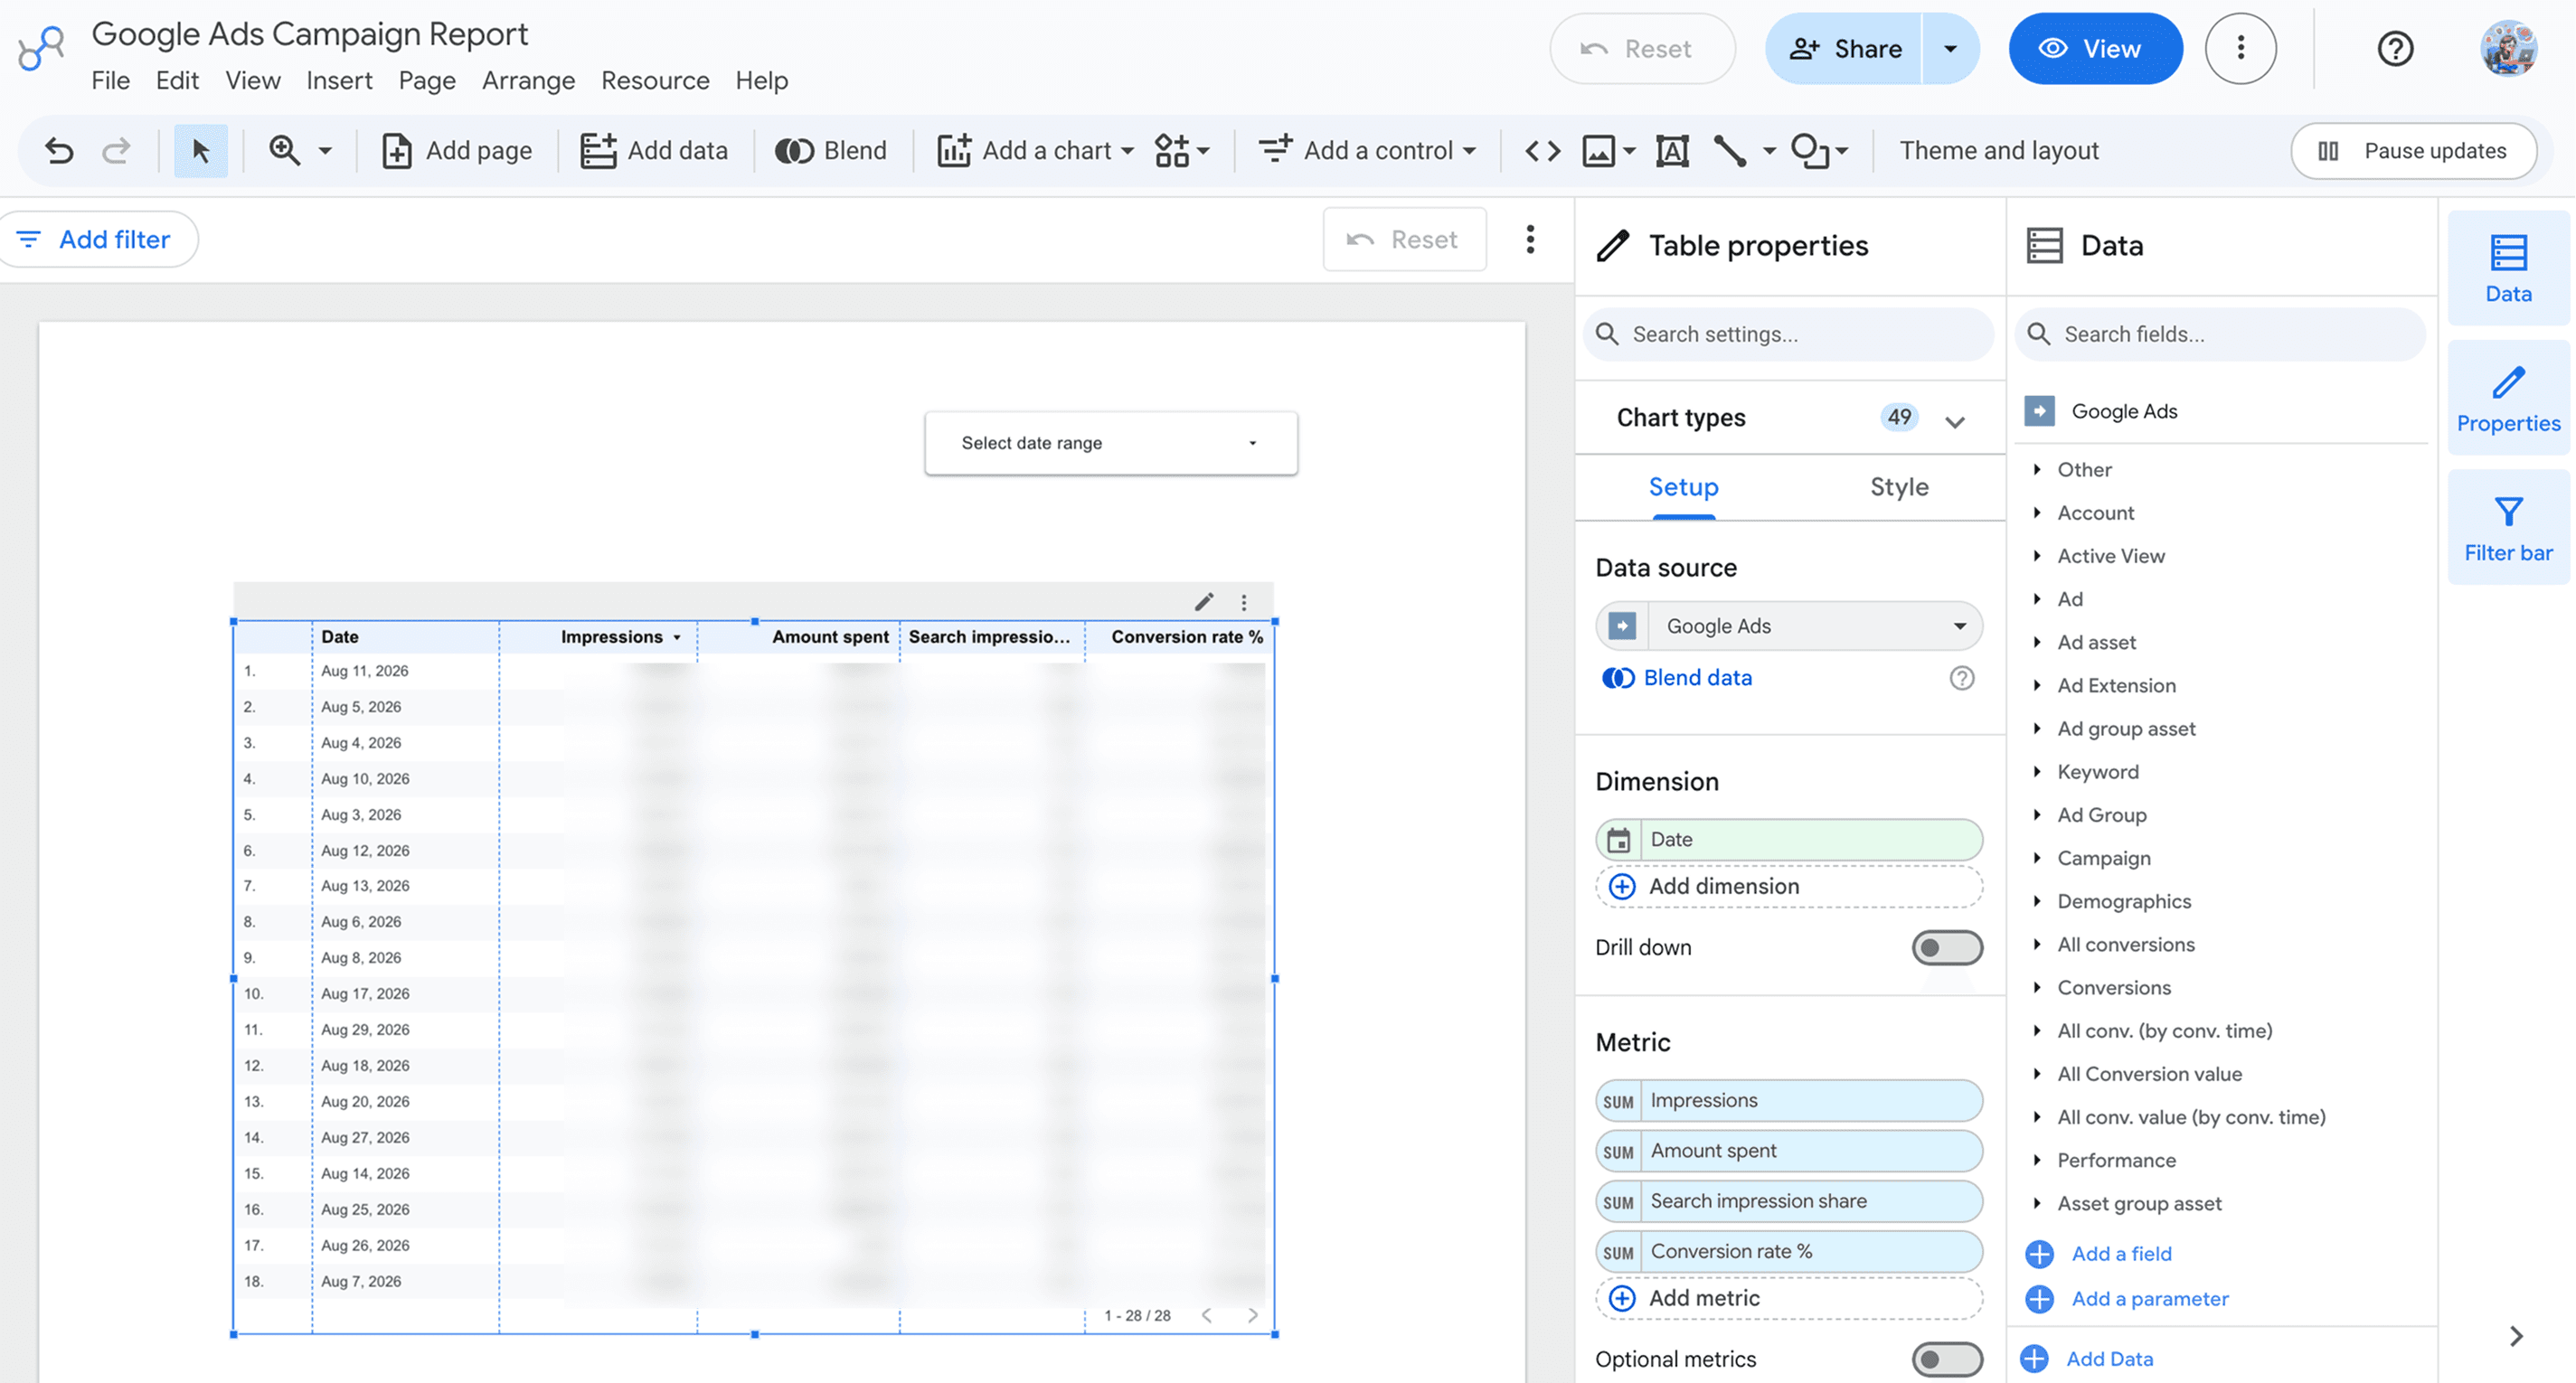
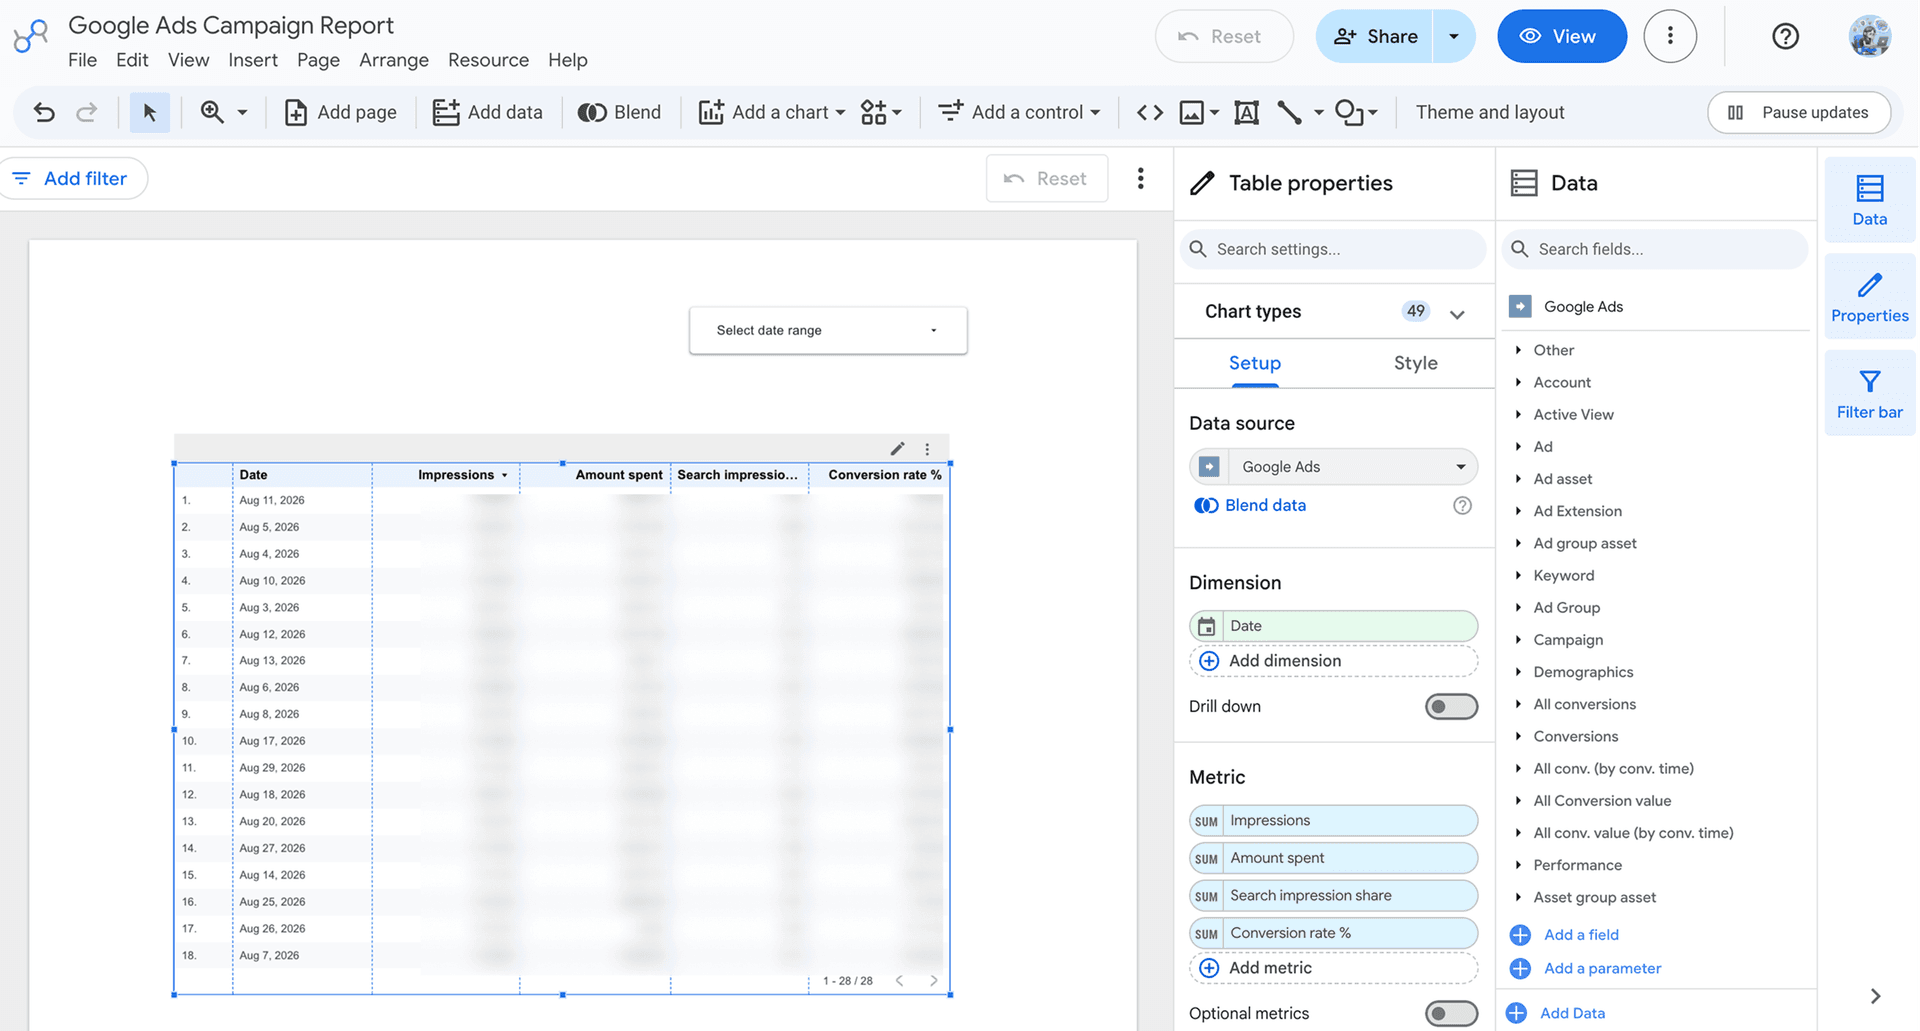
That’s it. You can insert any type of visual element to demonstrate your Google Ads campaign performance. Just select the chart type, and the data flows in automatically, helping you track the latest performance insights in one place.
Once your Google Ads data is in Google Data Studio, you can track key metrics such as CTR, CPC, CPA, conversion rate, etc over time. Google Ads performance varies significantly across industries, with median CPC ranging from $0.23 to $4.57. Median conversion rates range from 2.61% to 13.90%, while ROAS ranges from 0.15x to 7.62x.
To see how your campaigns compare with our industries, explore our Google Ads benchmarks.
Method 2: Connect Google Ads to Data Studio using Pre-built Templates
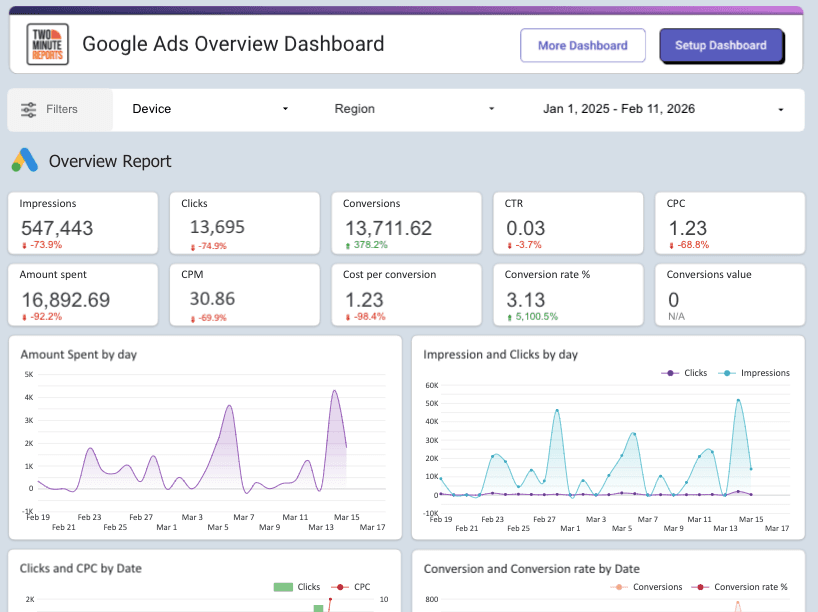
For this example, let us choose the Google Ads Overview Dashboard. Here’s what’s inside the template:
Key performance metrics: Impressions, CPC, clicks, cost, conversions. These metrics are presented as scorecards and graphs.
Budget and cost trends: View your configured budget over time and compare your advertising spend.
Campaign performance: The campaign table provides a detailed view of Campaign Name, Timezone, Advertising Channel Type, Cost, Impressions, Conversions, Budget delivery, etc.
Campaign Click Distribution: A pie chart showing the number of clicks generated by each campaign. This gives you a visual breakdown of how clicks are distributed across campaigns.
Keyword Performance: The keyword table includes currency, bidding strategy, impressions, interactions, interaction rate, cost, etc, helping you to assess the effectiveness of your campaign keywords.
Overall, it combines high-level KPIs, budgets, cost trends, campaign-level data, click distribution and keyword-level performance in one Data Studio dashboard.
To connect your Google Ads data:
- Click Get Template for Free to open the Google Ads Overview Dashboard in Data Studio.
- Click Use My Own Data and select your team and Google Ads Query Configuration created in Step 2 (Method 1).
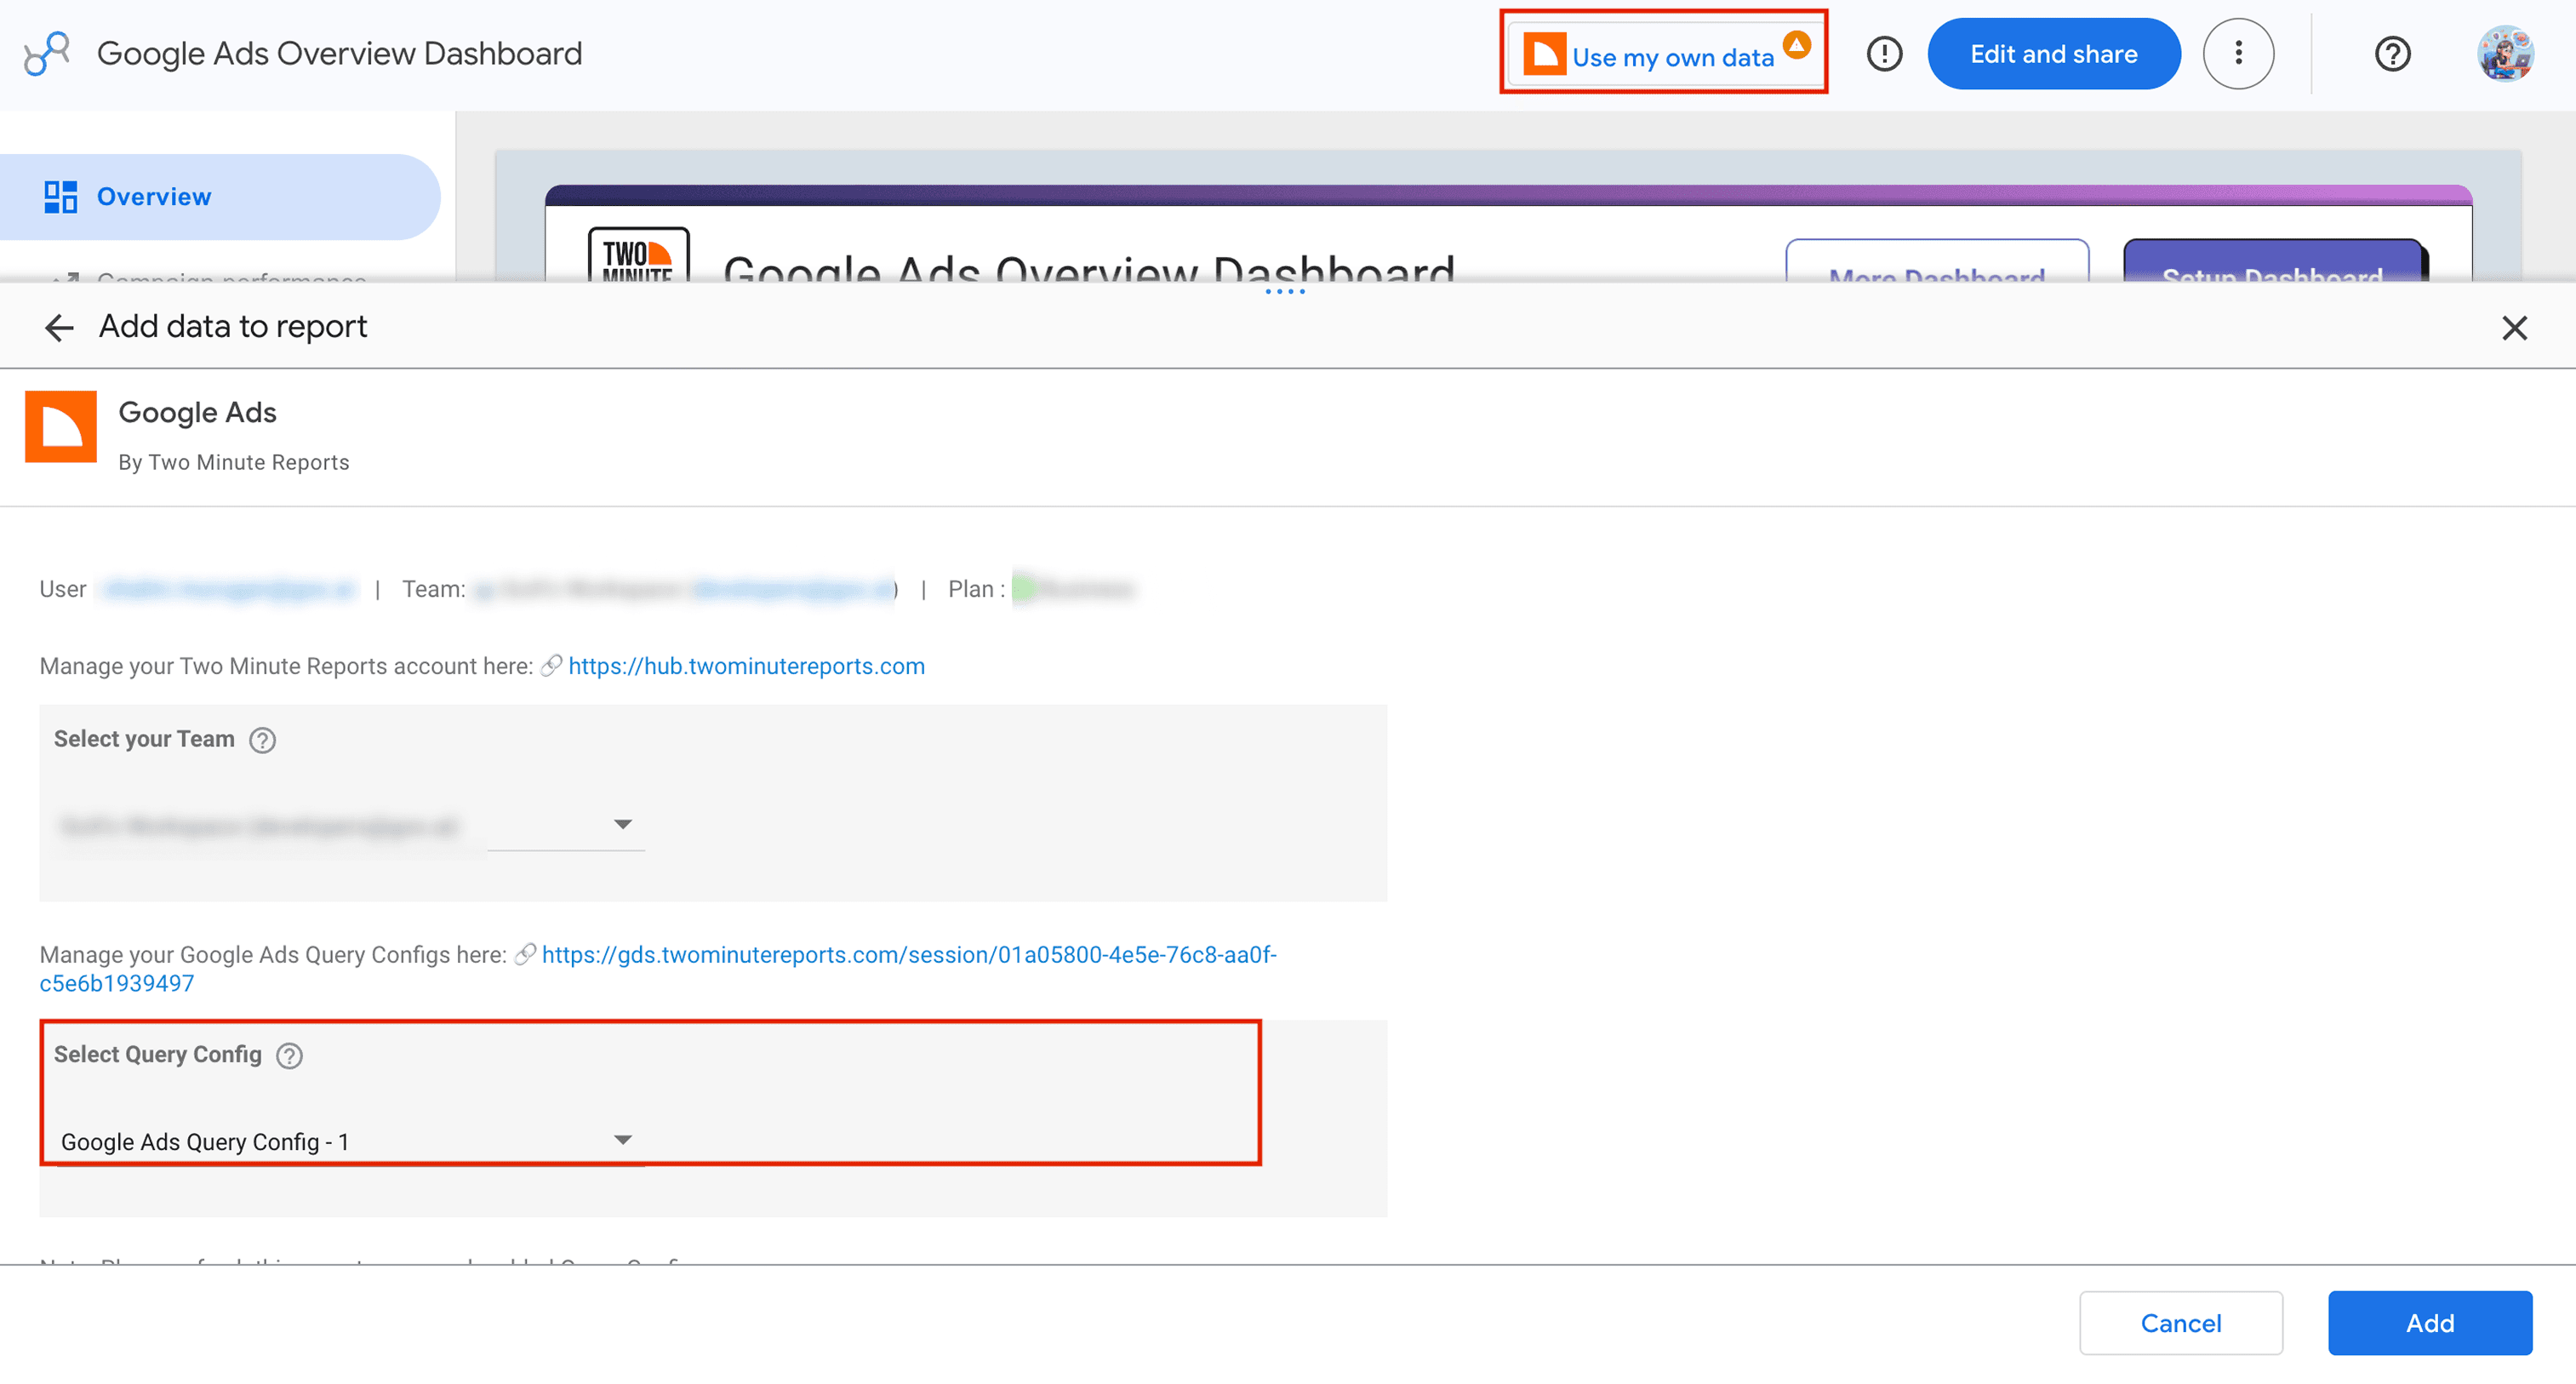
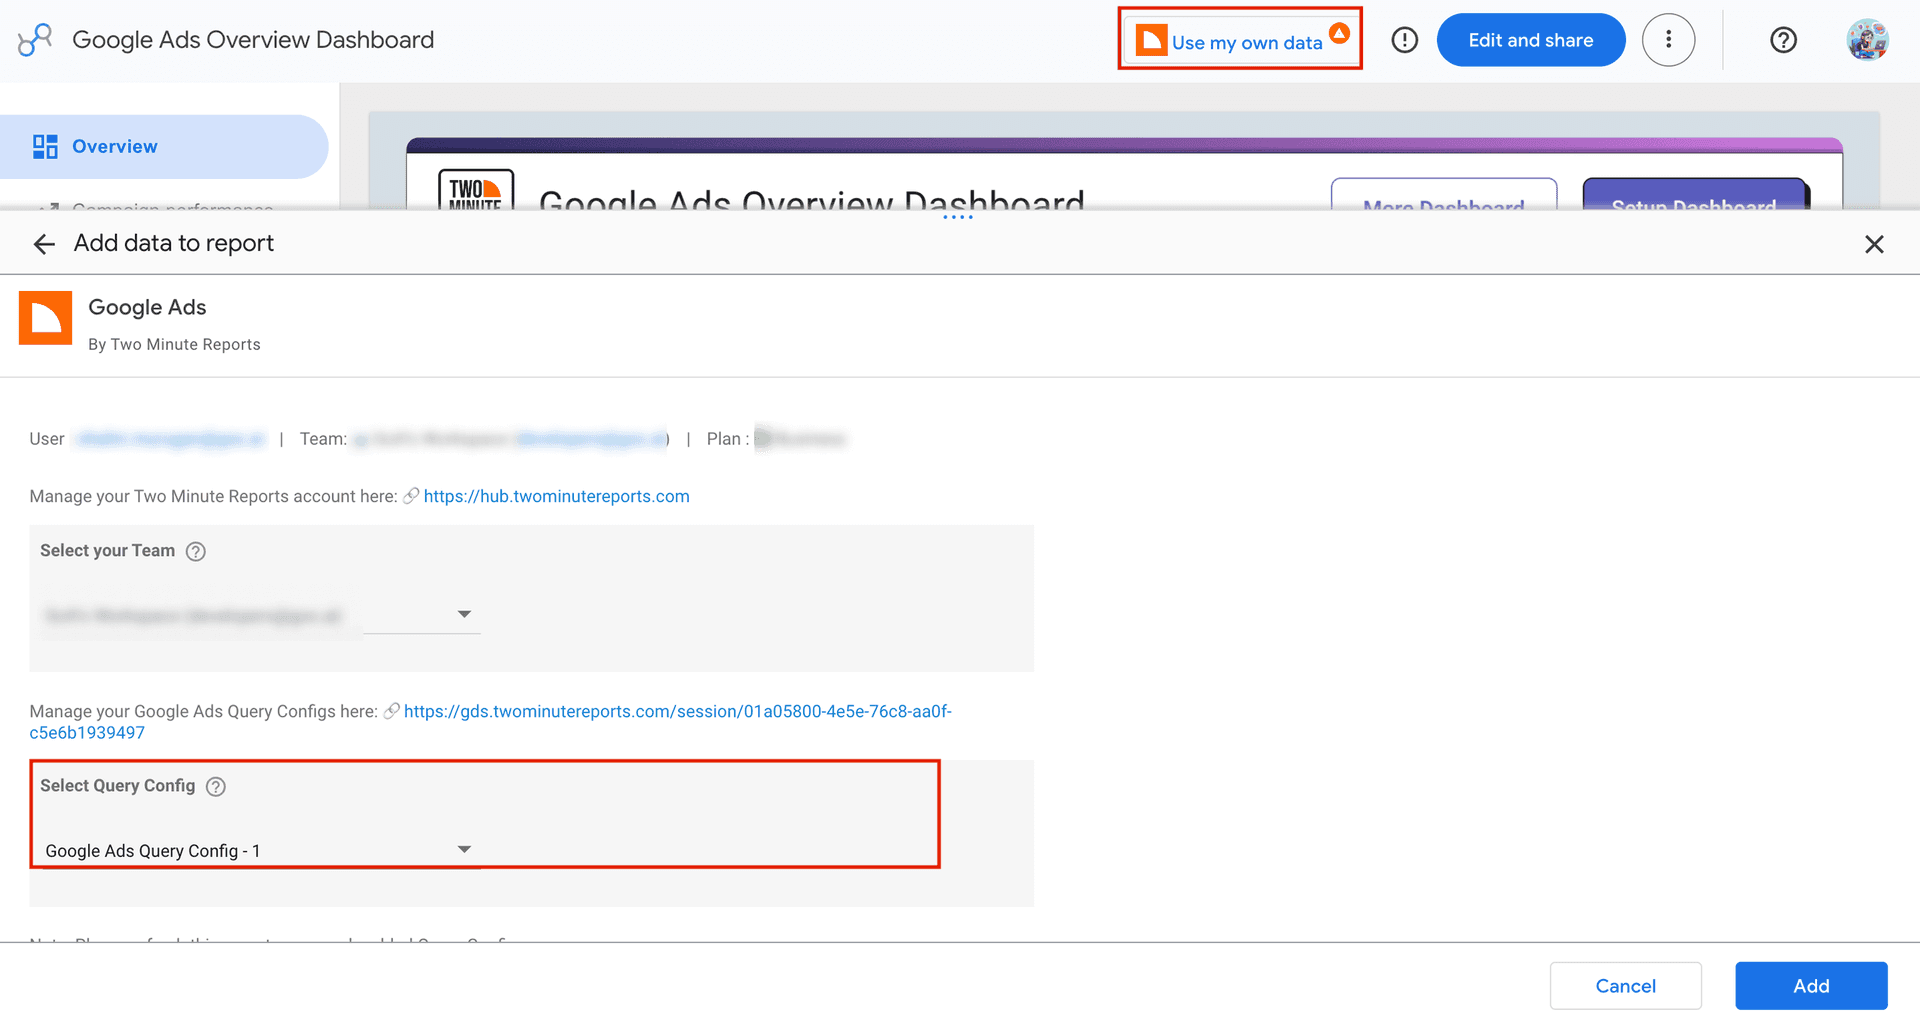
- Click Add. Your Google Ads data will be automatically populated in the dashboard.
- Click Edit to customize the layout, drag and drop metrics and adjust the visual elements to match your brand.
- Once done, click Share to send your Google Ads Data Studio dashboard to your clients and stakeholders.
Click the template link below to get started. It opens directly in Data Studio.
Benefits of connecting Google Ads data to Google Data Studio
Connecting Google Ads to Google Data Studio helps you centralize your campaign(s) performance for seamless reporting. Here are the benefits of connecting your Google Ads data to Google Data Studio via Two Minute Reports:
- Zero row limits – get the freedom to create and automate comprehensive Google Ads reports in Google Data Studio.
- Deliver visually stunning, professional Google Ads Google Data Studio dashboards to clients via easy-to-customize templates.
- Access real-time Google Ad metrics such as clicks, conversions, CPM, ROAS, CPA, Quality Score, etc to understand what’s working and spot actions for improvement.
- Measure cross-platform ad spend in seconds and take action to optimize goals and ROI.
- Add custom logos, interactive layouts and personalized styles to make every Google Data Studio report truly unique to your agency.
Pro tip: Track and visualize multi-client Google Ads campaigns in a single Data Studio dashboard. Explore our free Google Ads Data Studio templates.
Top metrics to use in your Google Ads Google Data Studio dashboard
Here are some important metrics to include in your Google Ads Google Data Studio dashboard, which can help improve your campaign performance analysis:
Videos
Conversions
Impression share
Keywords
By tracking these crucial metrics in real-time, you can spot winning opportunities, improve underperforming campaigns, and streamline ROI analysis for maximum impact.
Optimize your ROI with seamless Google Ads to Google Data Studio integration
With Two Minute Reports, effortlessly connect your Google Ads data to Google Data Studio and get access to instant, data-driven campaign performance insights. No dashboard switching or manually copy-pasting KPIs. Get real-time, actionable analytics with powerful visualizations that speed up reporting and help optimize your client’s ROI.
Want to see the difference for yourself? Try Two Minute Reports free for 14 days and understand how easier and effective Google Ads reporting can be.
Frequently Asked Questions
First, connect your Google Ads account to Two Minute Reports. Then, select your Google Ads accounts and create a Query Config with the data you want to use. Once connected, your Google Ads data will be exported to Google Data Studio, and you can create performance dashboards to track and analyze campaign performance.
You can access our free, ready-to-share Google Ads Google Data Studio templates to streamline campaign tracking. Once you click “Use my own data”, you can select the Query Config, customize the Google Data Studio dashboard and deliver impactful insights to your clients or stakeholders.
With Google Data Studio’s data blending, you can compare Google Ads with other PPC platforms, such as Facebook Ads, LinkedIn, etc, into a single dashboard and unlock cross-channel ROI. No need to toggle between platforms or copy-paste KPIs manually.
You can import your client’s Google Ads accounts and visualize a complete breakdown of performance across multiple campaigns (account, campaign, ad group, and ads) in a single dashboard. This granular analysis helps you understand what’s working, what needs improvement, and helps you act on the next steps to optimize profits.
Yes. With Two Minute Reports’ Google Ads Google Data Studio connector, you can connect multiple Google Ads accounts in a single Google Data Studio dashboard. You can also use the pre-built Google Ads Google Data Studio templates to consolidate your advertising data and visualise a holistic view of your campaign performance.
With Two Minute Reports’ Google Ads reporting tool, you can pull 100+ Google Ads metrics including clicks, amount spent, CTR, CPC, CPM, ROAS, conversions, etc. You can also use dimensions such as date, account ID, campaign, ad group, budget, and keywords to build custom Google Ads dashboards in Google Data Studio.
Use Data Studio’s built-in email delivery. Go to Share → Schedule delivery, set your repeat frequency (eg: daily), pick a time, confirm the timezone, add recipients and click Save. Your updated Google Ads dashboards will land in your client’s inbox automatically.
You can analyze the performance of your Google Ads bidding strategy by tracking KPIs such as CPA, ROAS, conversion rate, cost per conversion, impression share and CTR. This makes it easier to evaluate whether your bidding strategy is aligned with your campaign goals and identify when adjustments may be needed.

Meet the Author
Shalini MuruganShalini is driven by ideas that create a tangible impact. At Two Minute Reports, she specializes in content that helps marketers optimize their reporting workflows. When she's not transforming complex data into meaningful insights, you might find her lost in a book, jotting down ideas in her notebook, or connecting the dots others overlook.