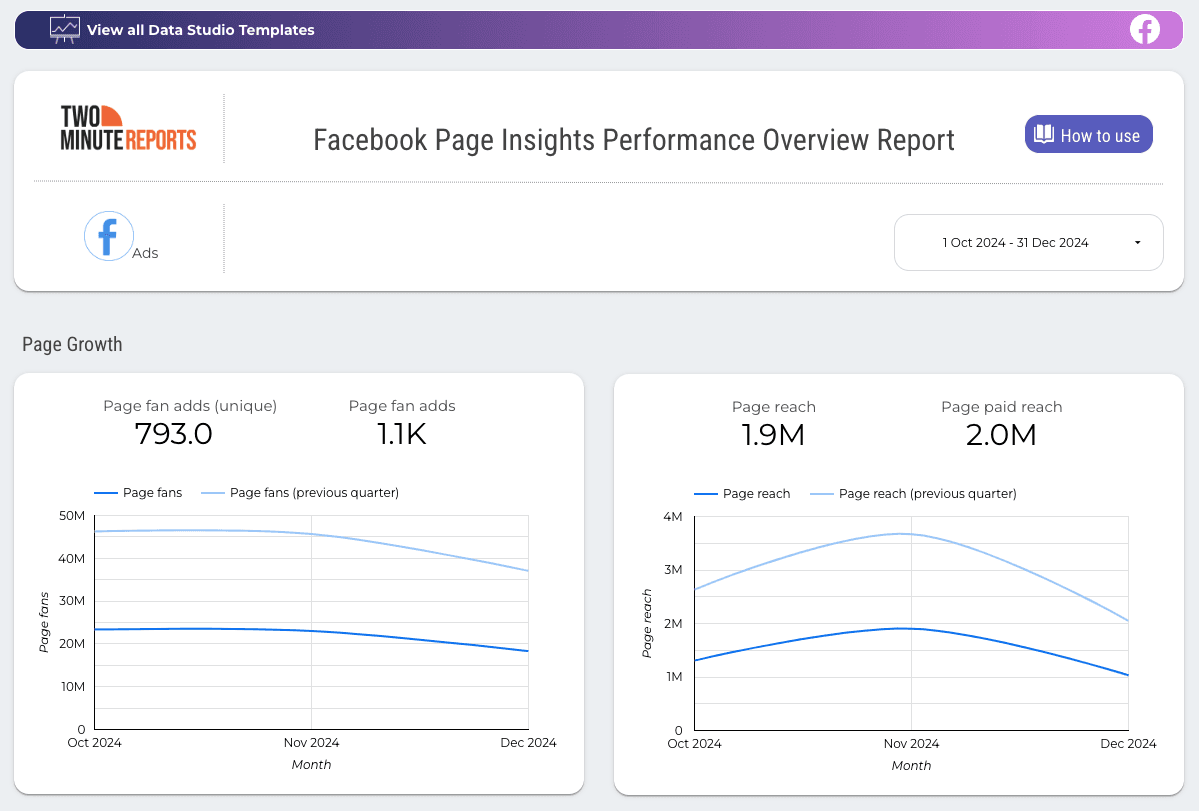
Facebook Page Insights Performance Overview Report
About the template
This is a unique dashboard that compares the data of 2 quarters, with the ability for the user to dynamically change the months. This interactive dashboard includes important data such as Page fan adds, page reach, page paid reach, page impressions, page paid impressions, page performance, audience engagement and reactions for the page.
1) How much is my page growing: This section features an interactive scorecard that compares the page fan adds, page reach, page paid reach, page impressions and page paid impressions. It also includes dynamic charts.
2) Are the audience engaged: This section showcases dynamic charts for page performance and the audience engagement.
3) It also includes scorecard charts that compare different user reactions such as haha, like, love, wow, sorry, and anger.
More Social Media Templates for Looker Studio
View allReport Categories
More Google Sheets Templates
View allMore Google Looker Studio Templates
View allTake back your time. Wow clients.
Get Two Minute Reports.
Start your free trial todayBuilt by marketers. Built for marketers.
