Facebook Page Insights Report for Google Looker Studio: Free & Customizable
Social Media
Gain deeper insights into your Facebook page's performance with this Looker Studio Facebook Insights Report template. Try it now!
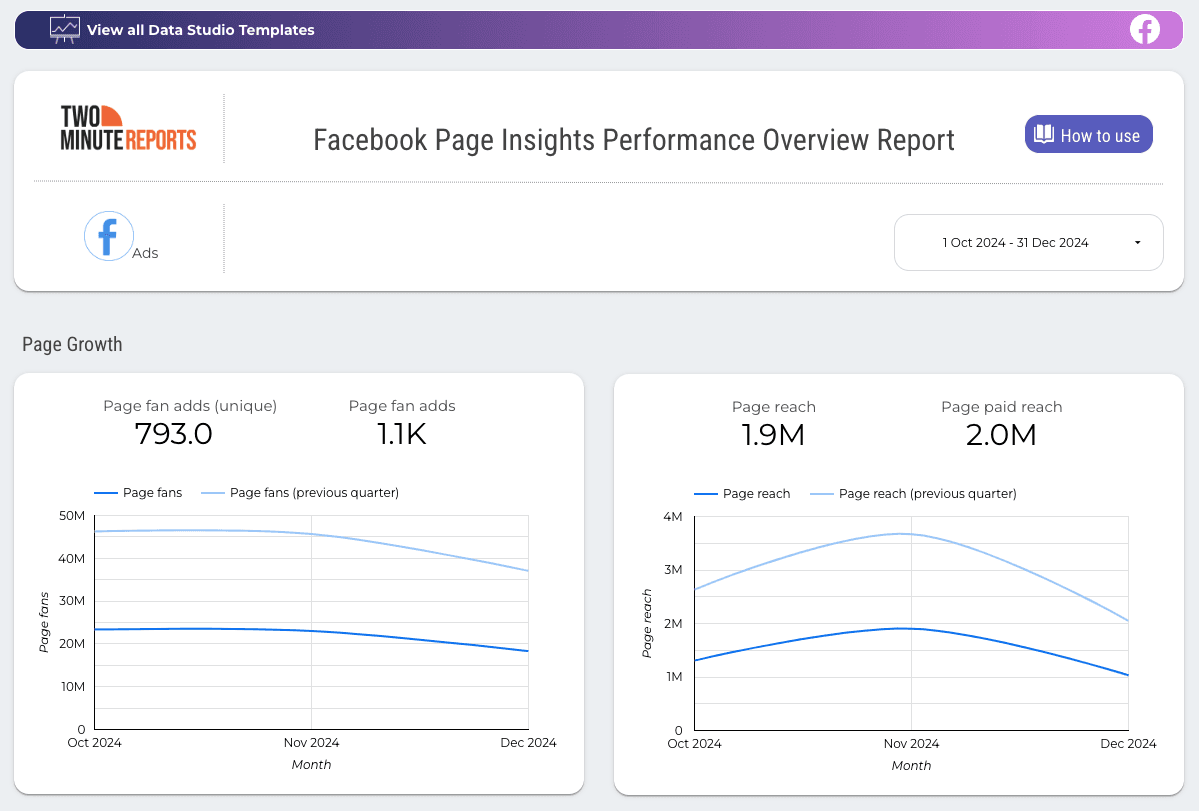
You can keep track of your Facebook insights with this detailed dashboard template.
Overview:
1) Contains scorecard charts showing the total video views, page reach and impressions followed by scorecard charts showing total page followers and total numbers for different reactions.
Breakdown:
1) It shows a bar graph to compare the paid and post impressions for different pages.
2) The pie charts show post clicks and total video views for different pages.
3) A bar graph shows page reach for different pages,
More Social Media Templates for Looker Studio
View allReport Categories
More Google Sheets Templates
View allMore Google Looker Studio Templates
View allTake back your time. Wow clients.
Get Two Minute Reports.
Start your free trial todayBuilt by marketers. Built for marketers.
