About the template
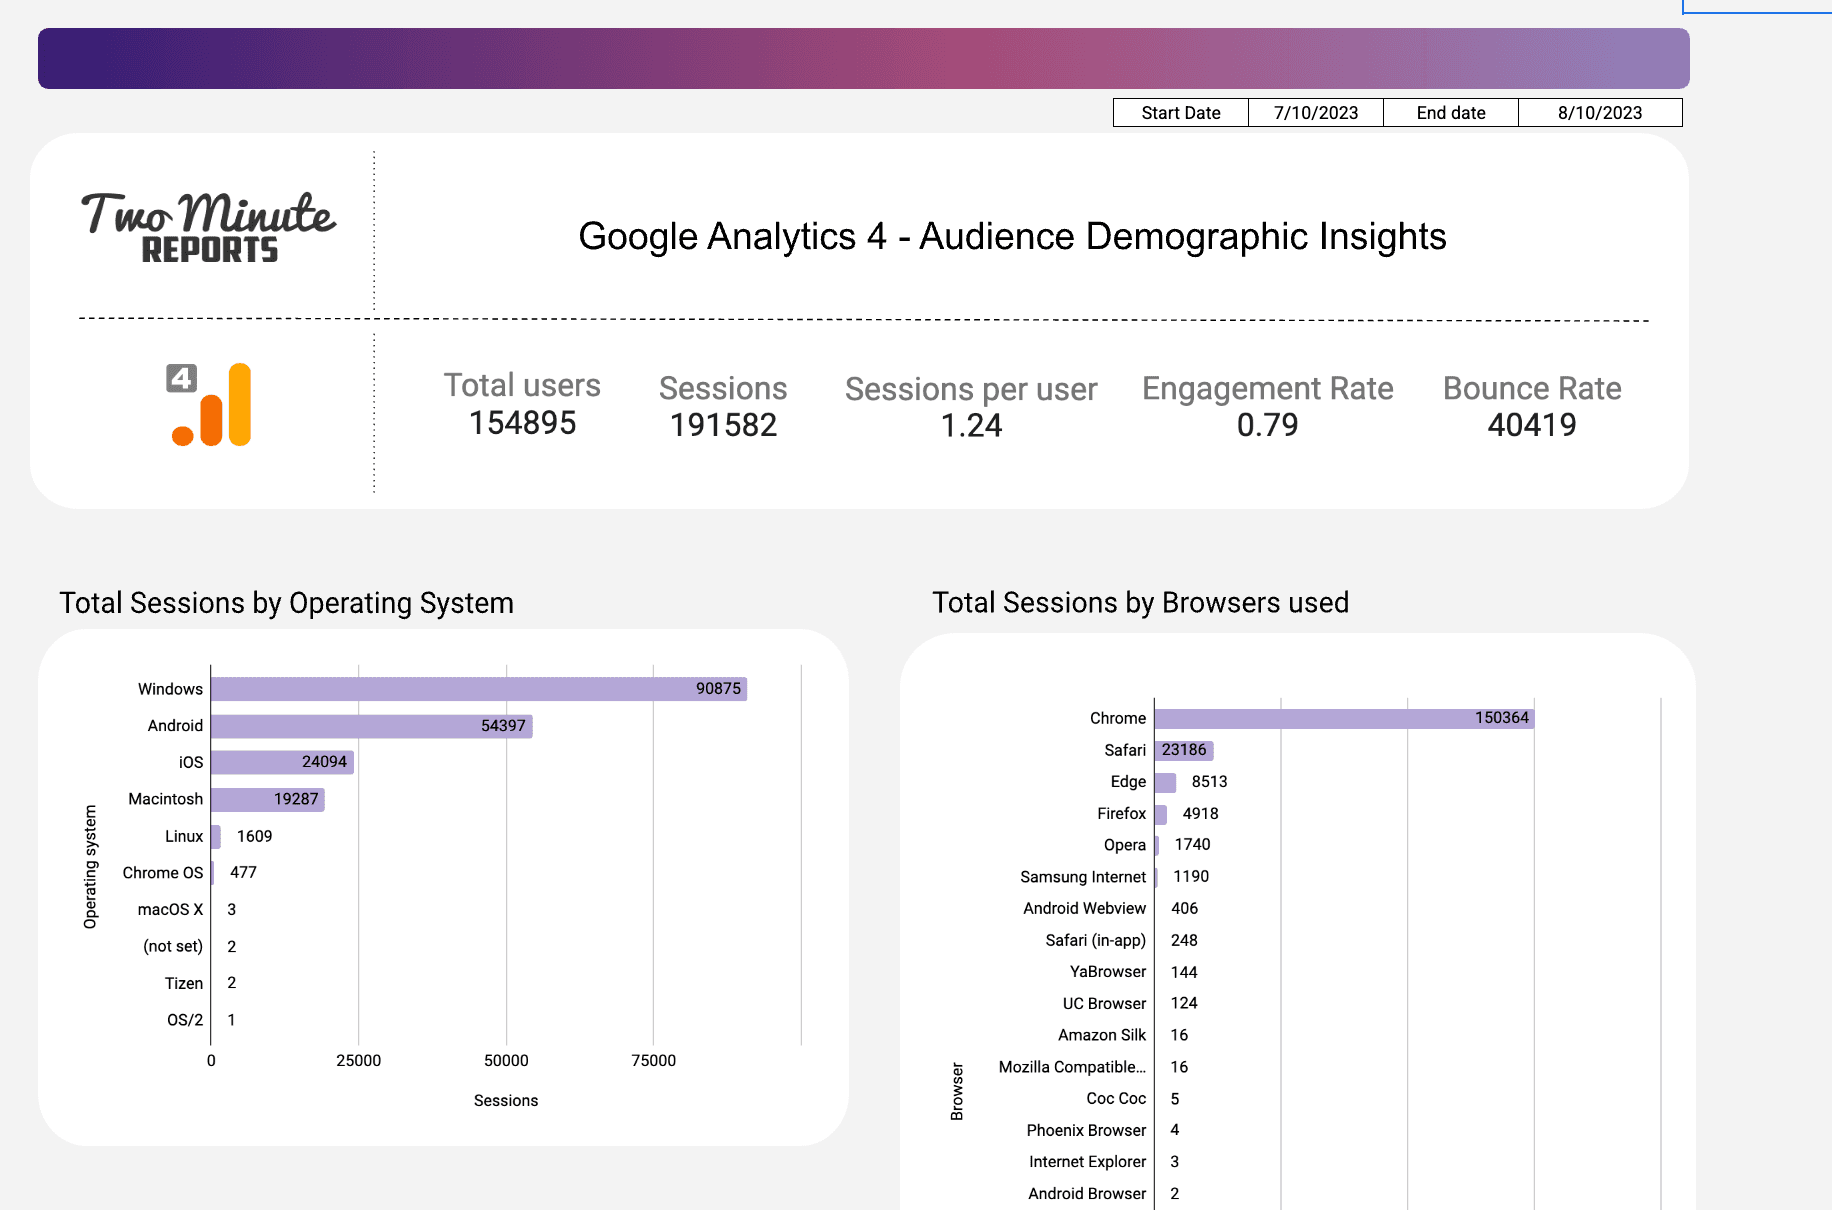
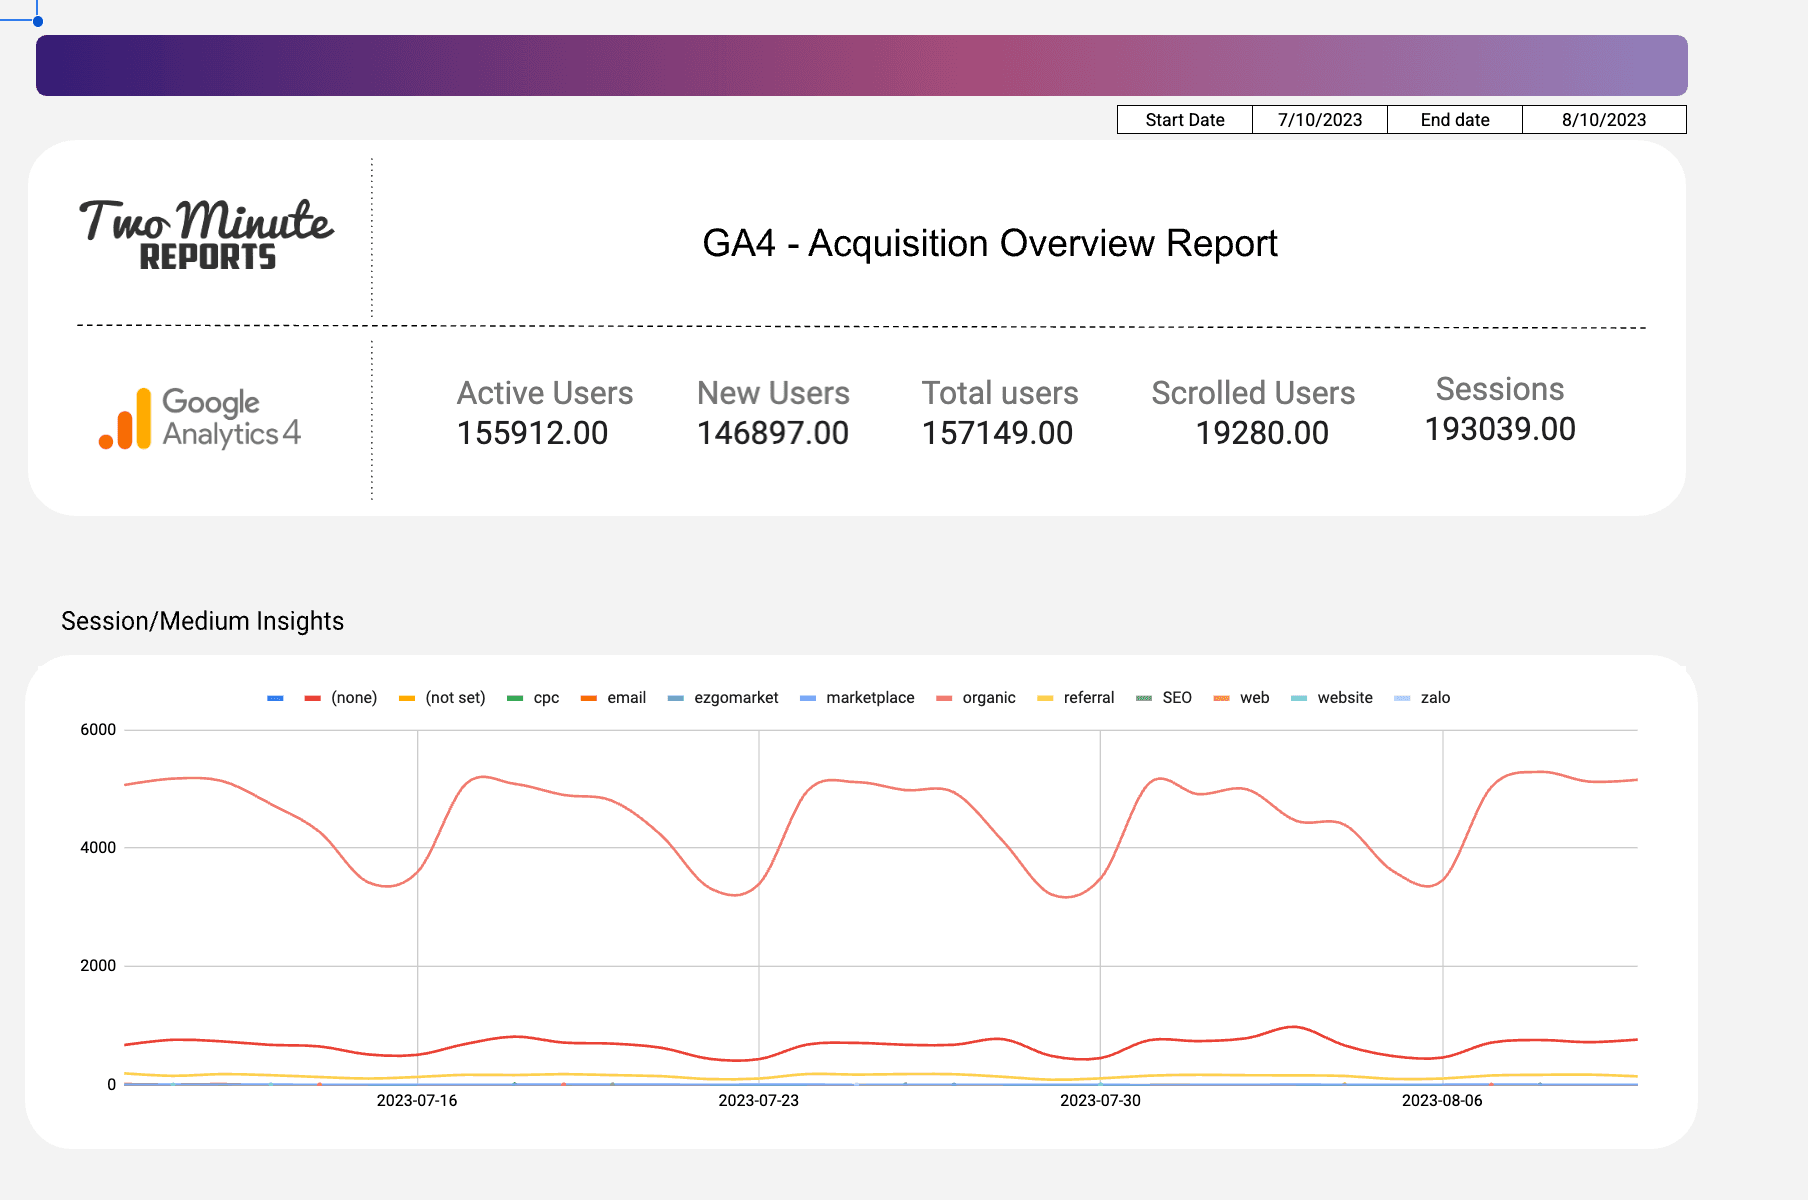
This is an interesting dashboard on Google Analytics 4 data, which consists of major KPI's like Conversion by Events, Conversion by Channels, Total users, Conversions, Conversion rate, Transactions, Revenue etc. There is also a graph chart for Total Users vs Conversions, Total Users and Conversions vs Medium. You also get column charts for User by Device, User by Gender, Conversion by Device Conversion by Gender and Conversion by Country. And finally you have Campaign Analysis and Analysis by Medium. Check out this template to get a real-time experience of the Report.
More Web Analytics Templates for Looker Studio
View allReport Categories
More Google Sheets Templates
View allMore Google Looker Studio Templates
View allTake back your time. Wow clients.
Get Two Minute Reports.
Start your free trial todayBuilt by marketers. Built for marketers.


