

Theming
Theming controls how a dashboard looks. A theme sets the background, fonts, colors, and widget styling for the whole dashboard at once, so everything looks consistent and on-brand. Use one of your team's themes, so that the dashboard changes when the theme changes, and override styling on individual widgets where you need to.
What you can do
- Use one of your team's themes, and keep the dashboard in step with it
- Change this dashboard on top of its theme, or undo those changes
- Start from a preset, or take the colors from an image
- Set backgrounds, typography, and a semantic color palette
- Define default widget styling and chart appearance
- Override the theme on individual widgets
- Save the dashboard's look as a new theme
The Theme panel
To style the dashboard, select Edit, then select Theme in the side panel. Changes show on the canvas as you make them.
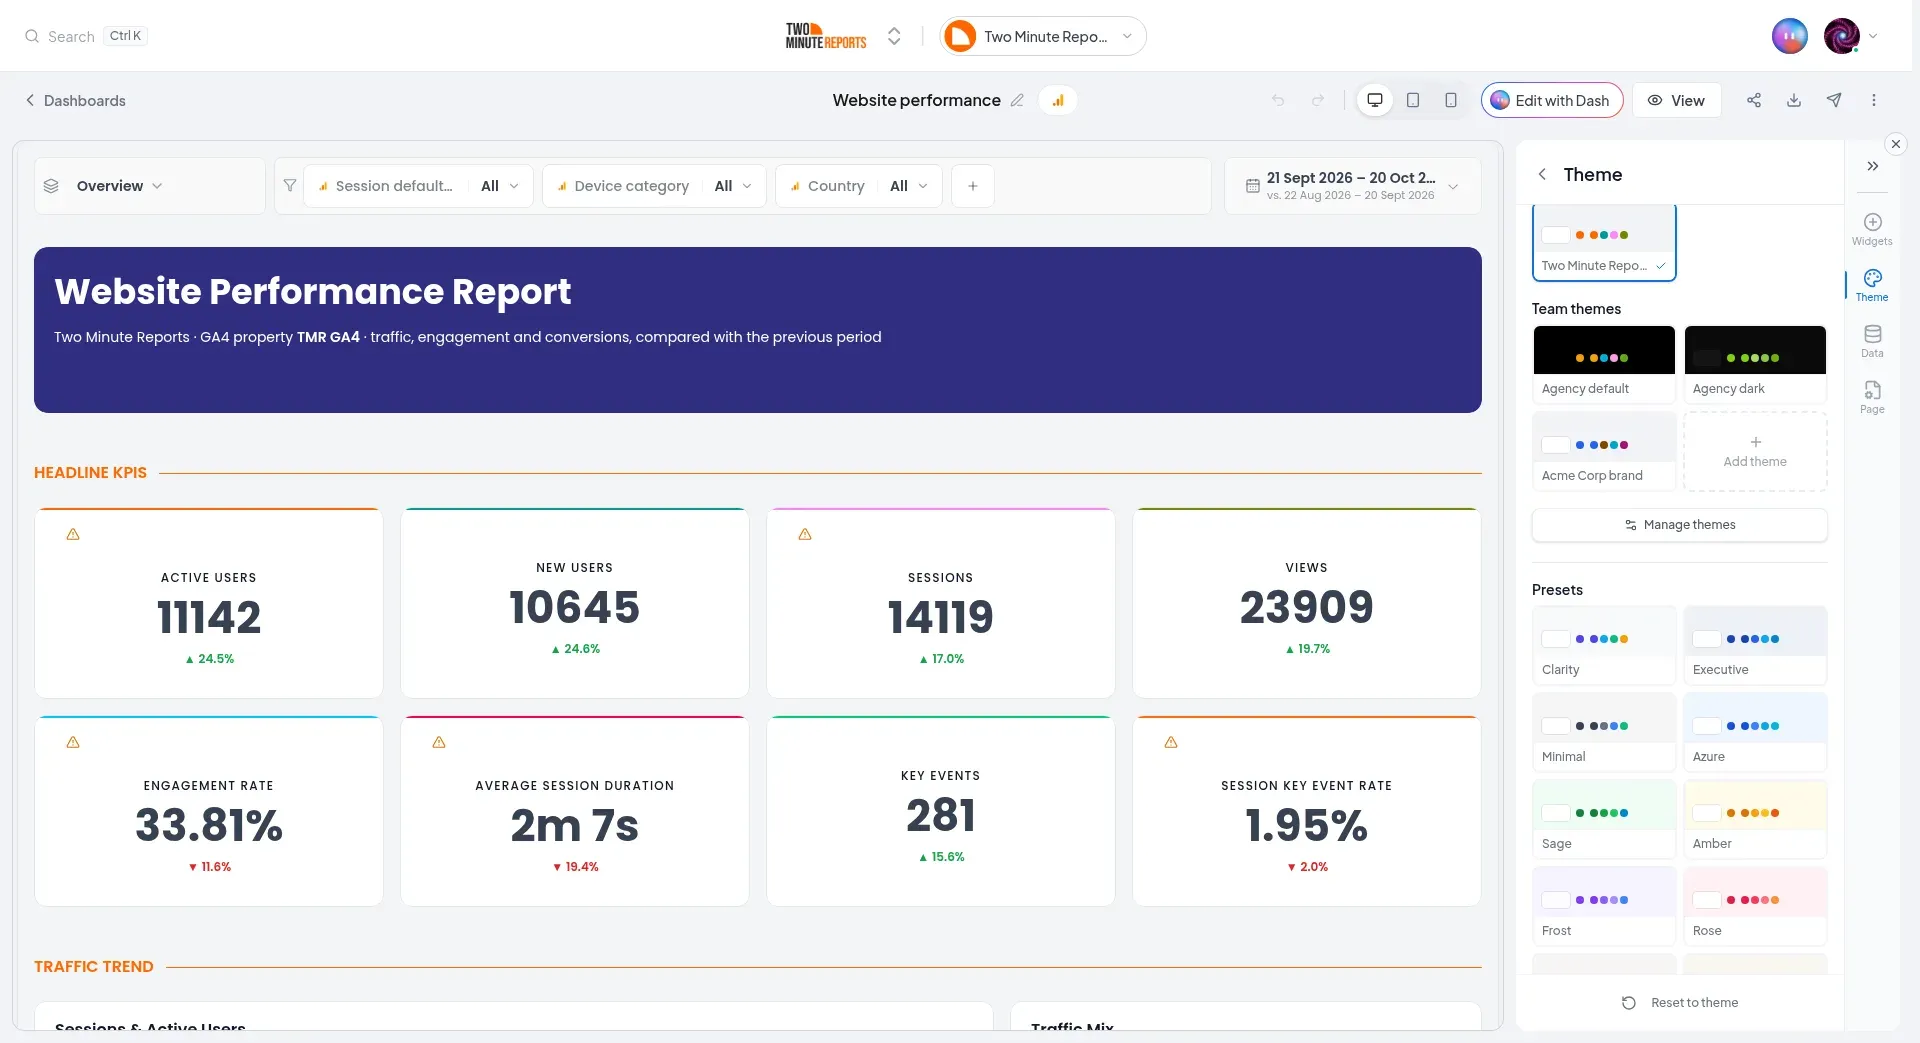
When the dashboard uses a theme, Uses {theme} is first in the panel. See Use a theme.
At the top of Theme:
- Dark mode: show the dark presets.
- Add theme (the plus icon): take the colors from an image, or open the theme builder.
- Save current theme (the bookmark icon): save this dashboard's look as a new theme.
Then the themes, in this order:
- For {client}: the themes of the dashboard's client, when the dashboard has one.
- Team themes: your team's other themes, with Add theme at the end.
- Manage themes: open the Themes page.
- Presets: ready-made looks.
Use a theme
Select one of your saved themes. The dashboard now uses that theme, and the top of the panel shows Uses {theme}:
- Edits to the theme restyle this dashboard. When anyone changes the theme, on the Themes page or from another dashboard, this dashboard changes too.
- The settings below change this dashboard only. They are kept on top of the theme. The card counts them, for example 1 change so far.
- Edit theme opens the theme in the theme builder. A change there reaches every dashboard and report that uses the theme.
- Undo it removes this dashboard's own changes, so it looks exactly like the theme again. Reset to theme, at the bottom of the panel, does the same.
- Stop using keeps the look the dashboard has now, as its own. Later edits to the theme do not reach it.
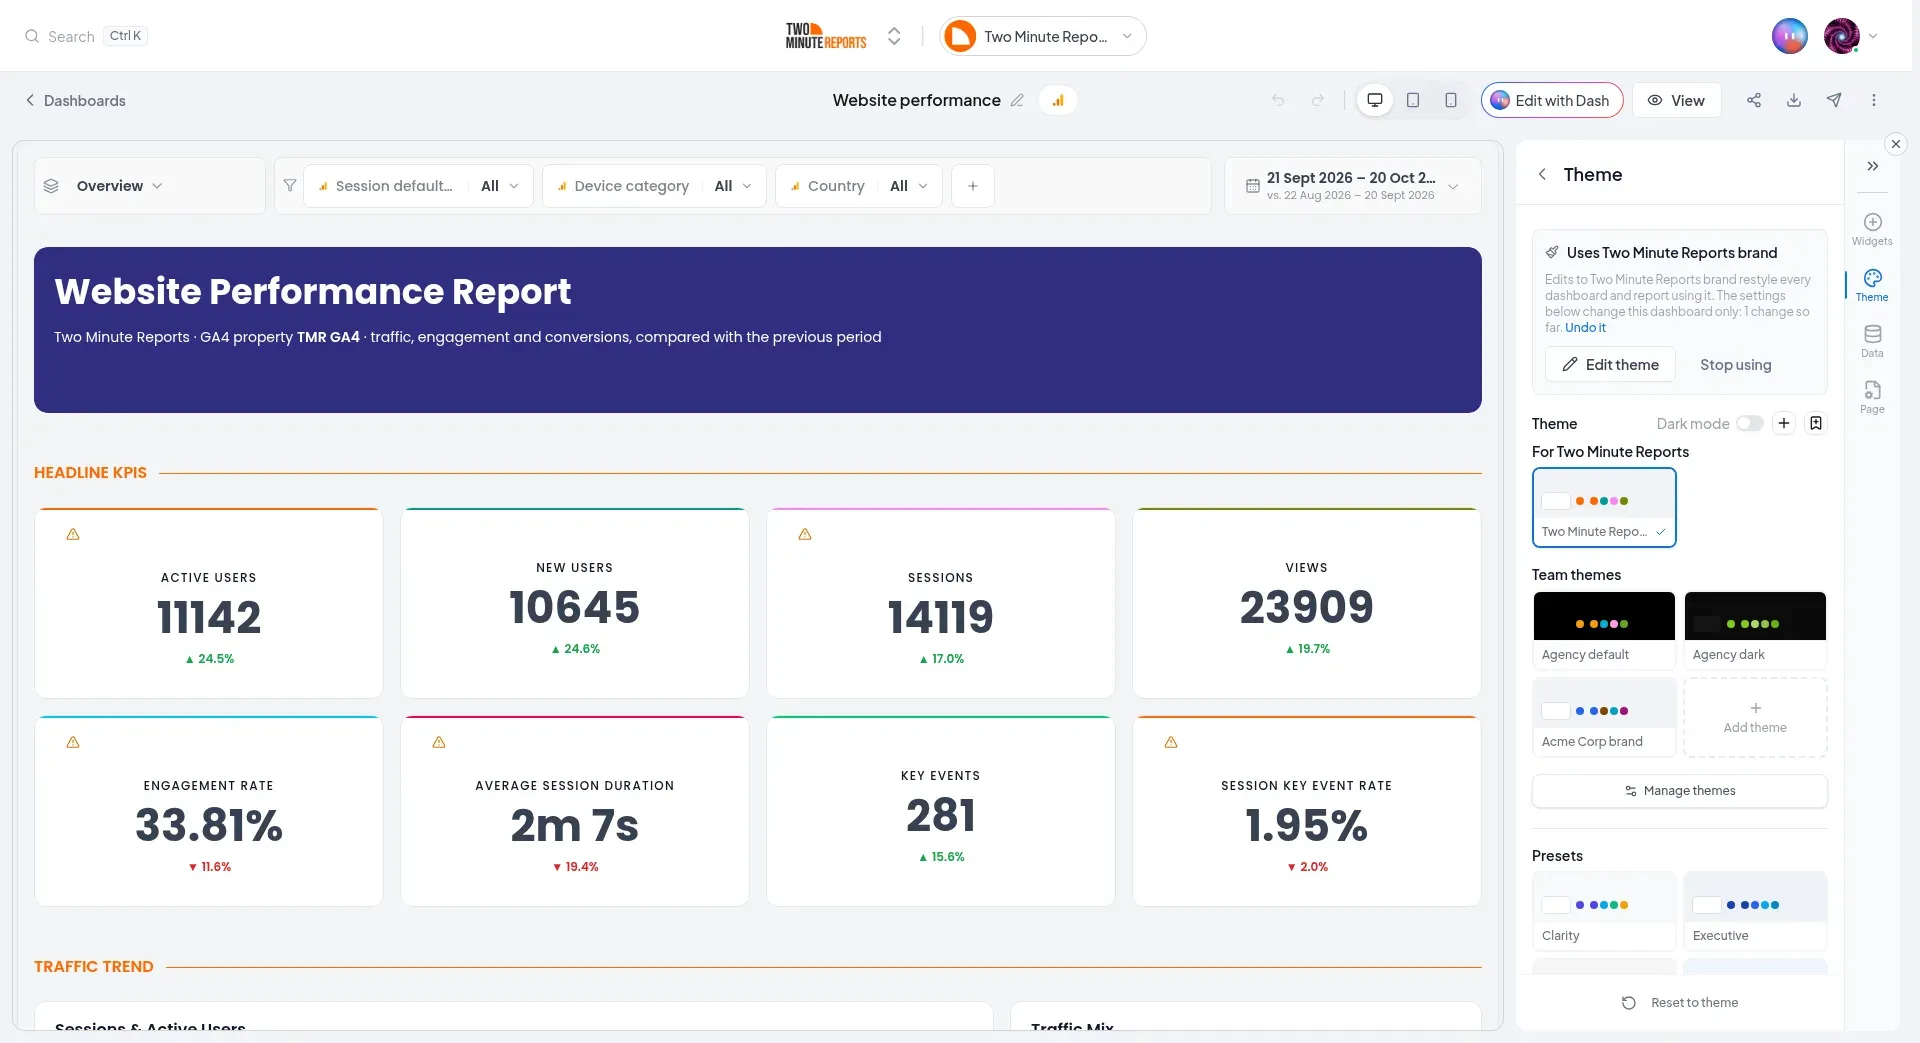
A preset is different from a saved theme: selecting a preset copies its look into the dashboard. Nothing links the dashboard to the preset.
A dashboard that does not use a theme keeps its look as its own. Reset to default, at the bottom of the panel, clears it back to the built-in look.
The settings
Below the themes, the panel has three groups. Each one opens and closes.
Colors
- Accent and palette: the accent color, and the chart colors made from it.
- Background: a solid color, a gradient, or an image from a URL, with Cover, Contain or Fill. Use it to match a client's brand or to give the dashboard a finished look.
- Page and widget: the widget background, body text, title text, subtitle text and border colors.
- Semantic colors: the colors that carry meaning across widgets:
- Positive: good outcomes (typically green)
- Negative: bad outcomes (typically red)
- Warning: values that need attention (typically amber)
- Neutral: baseline and secondary values
These colors flow into charts, compare deltas, and gauge zones, so good and bad always read the same way.
Typography
Choose the Font family, and the text sizes for Widget text, Headings, Chart text, Table, and Funnel and gauge.
Widgets
- Widget chrome: the default look of widget containers: border, corner radius, shadow, opacity, and padding. This gives every widget a consistent card style without setting them one by one.
- Content defaults and Section divider defaults: what widgets set to Auto use.
- Chart defaults: defaults that every chart set to Auto uses, such as legend position, grid lines, bar corner radius, area gradient, and donut hole size. Individual widgets can still override any of these (see Widgets and charts).
- Scorecard defaults and Table defaults.
- Animation: the Duration and Easing of chart animations when they load. A shorter duration gives a calmer feel.
Per-widget overrides
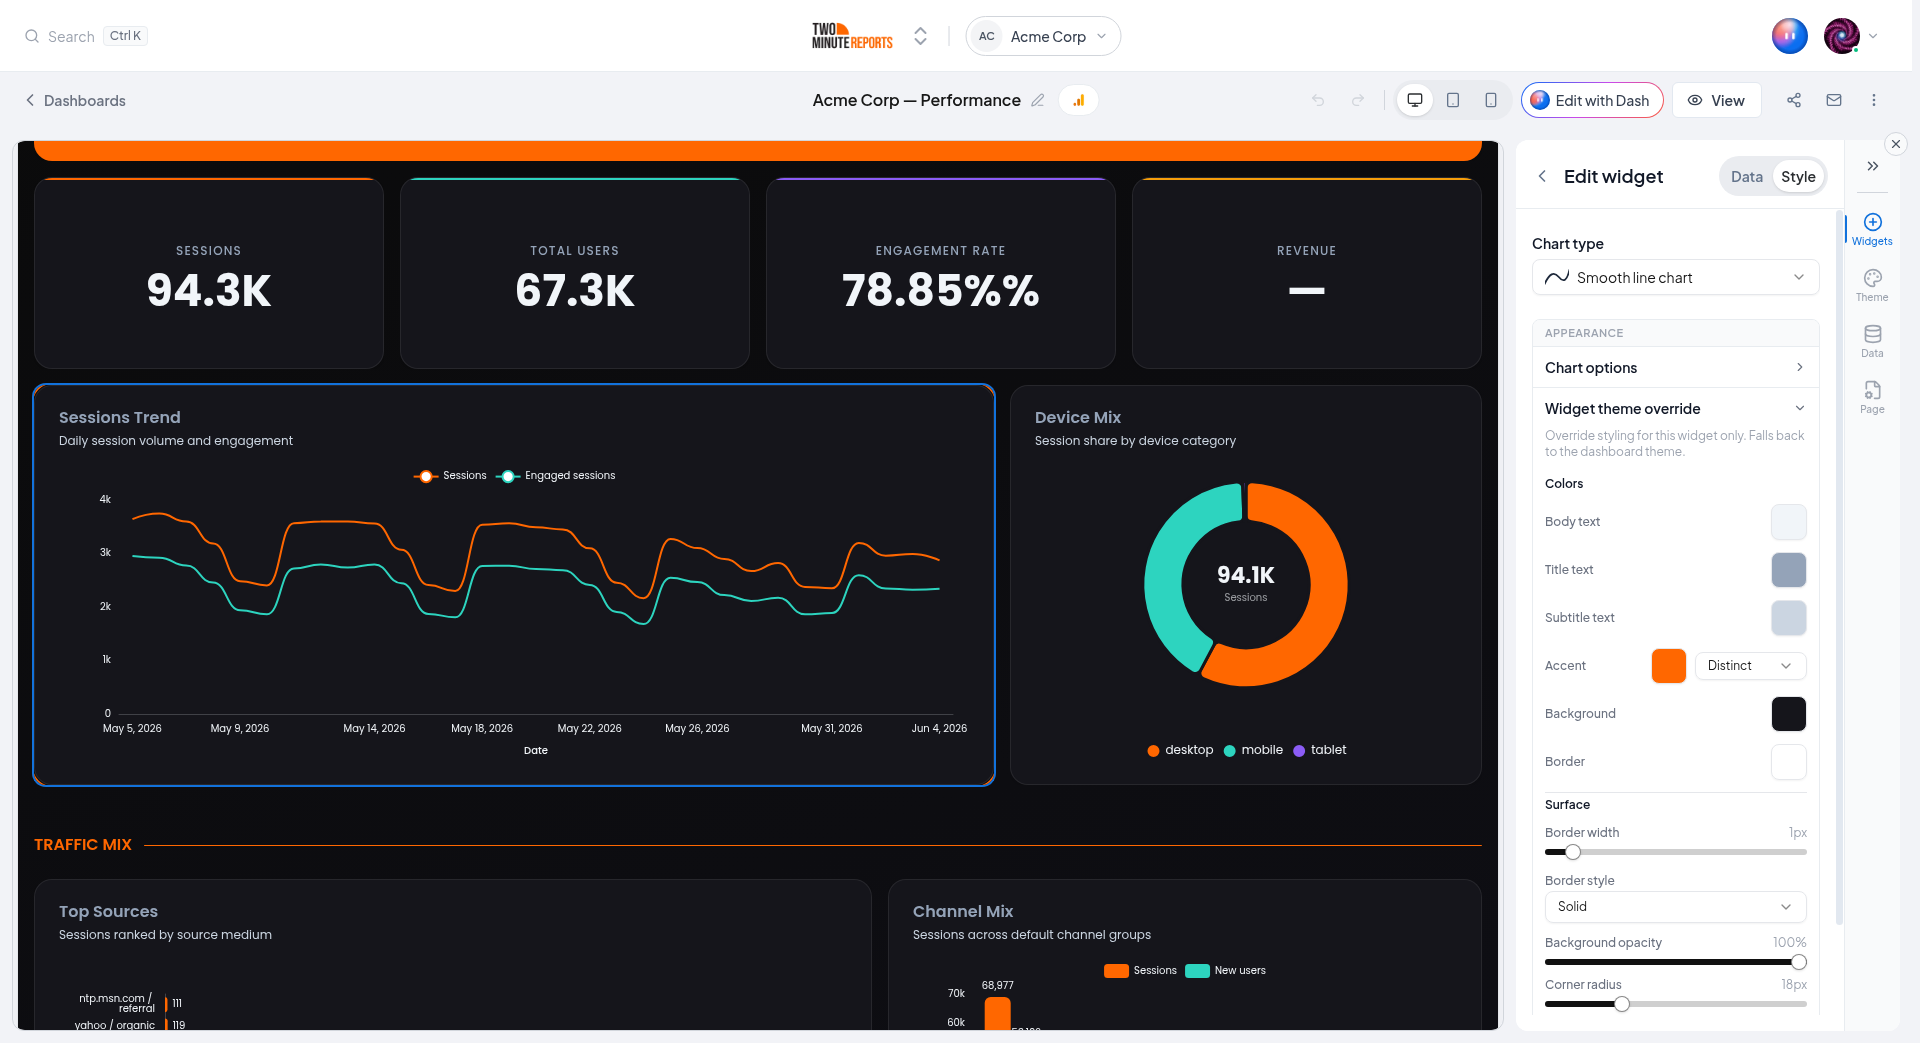
Sometimes one widget needs to stand out, for example a hero scorecard in your brand's accent color. In the widget editor, open the Style tab, then expand Widget theme override. Change the widget's colors, chart colors, and container styling there, independently of the dashboard theme. Everything else continues to follow the theme.
Save a dashboard's look as a theme
- In the Theme panel, select Save current theme (the bookmark icon).
- Enter a Theme name.
- If the dashboard has a client, select For {client} to make it that client's theme. It is then suggested first when you create a dashboard for that client. Otherwise, it is offered for every client.
- Select Save theme.
The dashboard then uses the new theme. Saving a theme needs the Create and edit themes permission.
Best practices
- Build one theme per client, and use it on all their dashboards. A rebrand is then one edit
- Keep semantic colors meaningful: don't use your "positive" green for a neutral metric
- Favor subtle widget styling (light borders, soft shadows) so the data stays the focus
- Preview in view mode and on a smaller screen to confirm contrast and readability
Next steps
- Themes - Create the themes your dashboards use
- Widgets and charts - Override chart appearance per widget
- Share and export dashboards - Share the themed dashboard with your client
- Layout and pages - Arrange the canvas your theme styles
Data, dates, and filters
Choose a dashboard's accounts, set date ranges with period comparisons, and apply filters across a whole dashboard in Two Minute Reports.
Share and export dashboards
Choose who can open a dashboard: only people you add, your client's contacts, or anyone with the link. Or export it to PDF or PNG.