

Goals
A goal is a target for one client, such as 400 conversions each month. Two Minute Reports reads the goal's metric from the client's connections and shows whether the goal is on pace to reach its target.
Each goal has a goal tree. The tree shows the goal at the top and the metrics that drive it below, such as the spend and clicks that bring conversions. When a goal falls behind, the tree shows which driver is off course.
What you can do
- Create a goal from a preset, such as Leads, ROAS or Conversions, or from any metric.
- Let Two Minute Reports suggest a goal, its drivers and their targets from the client's data.
- See the current value, the target and the projection for the end of the period.
- See how each driver moves with the goal.
- Simulate a change to a budget or a rate, and see how the goal changes.
- Track ad spend against a budget, and see the daily spend that keeps it on budget.
The Goals page
To open the Goals page, select Goals in the top bar.
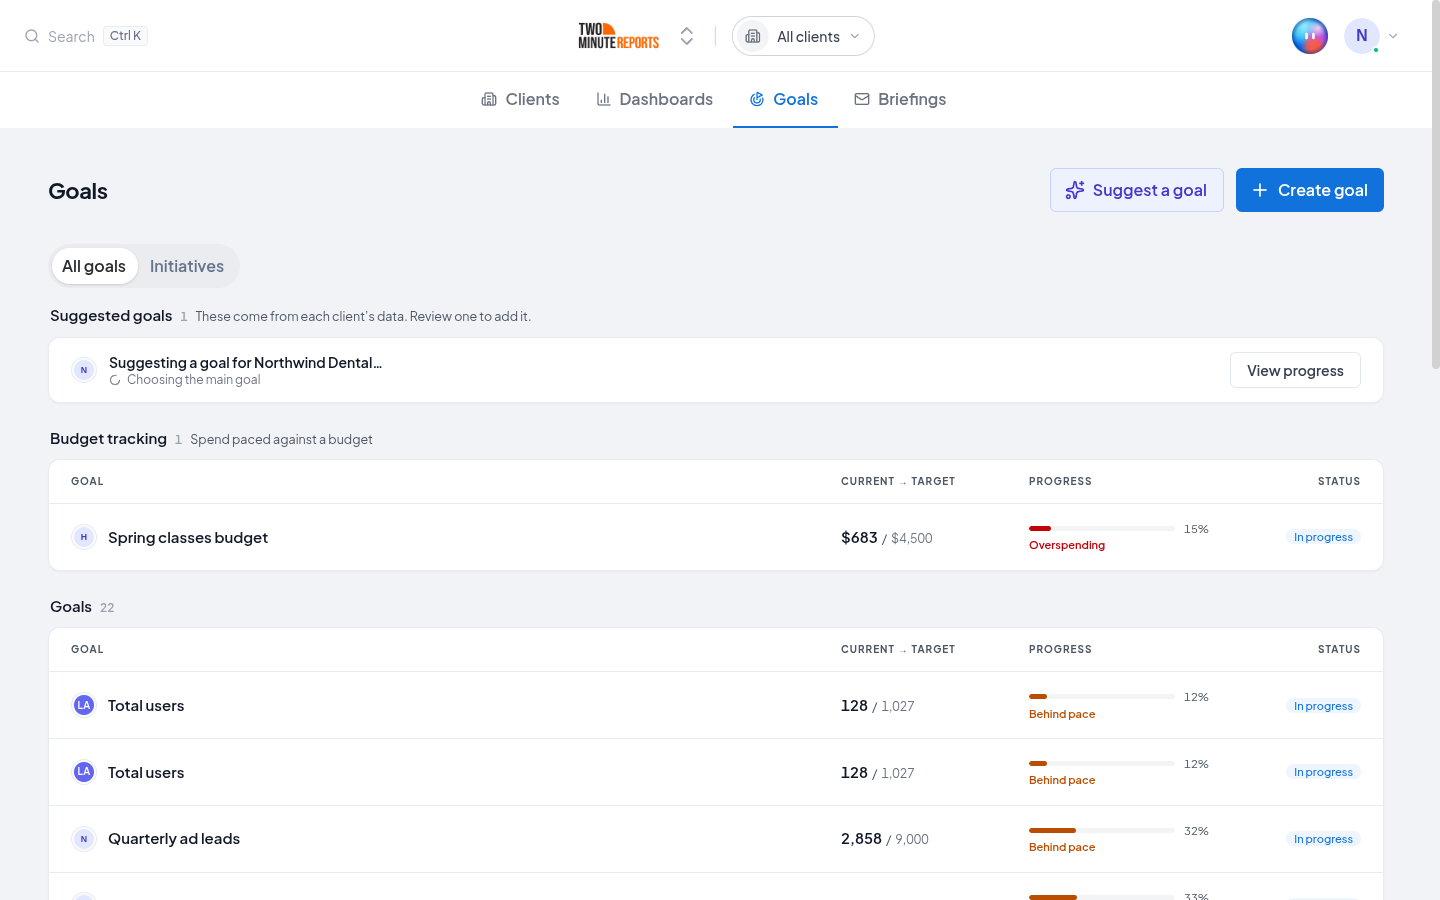
The Goals page has three lists:
- Suggested goals: suggestions that are running or ready to review. These come from each client's data.
- Budget tracking: goals that track ad spend against a budget.
- Goals: all other goals.
Each row shows the current value, the target, the progress and the status. Select a row to open the goal.
Create a goal
Step 1: Open Create goal
On the Goals page, select Create goal.
Step 2: Select the client and the metric
- In Client, select the client that the goal is for.
- Under Select a goal metric, select a card.
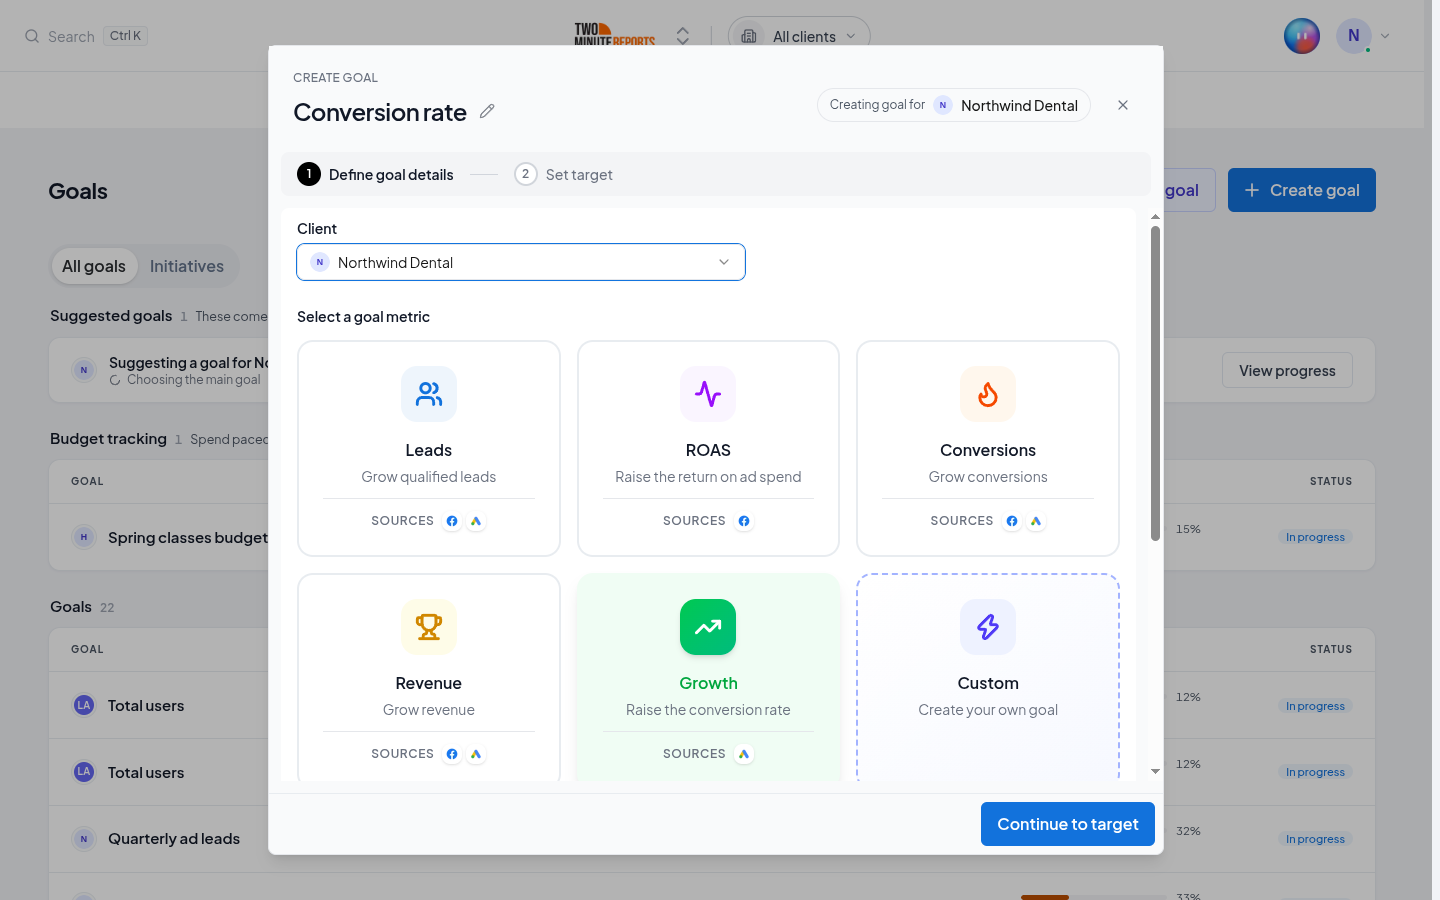
| Card | What the goal tracks |
|---|---|
| Leads | Qualified leads |
| ROAS | Return on ad spend |
| Conversions | Conversions |
| Revenue | Revenue |
| Growth | Conversion rate |
| Custom | A metric that you select |
A card shows only when one of the client's connectors reports its metric. Sources shows the connectors that feed the card. To track another metric, select Custom, then select the metric.
The goal name is the metric name. To change it, select the pencil icon next to the name.
Step 3: Set the goal settings
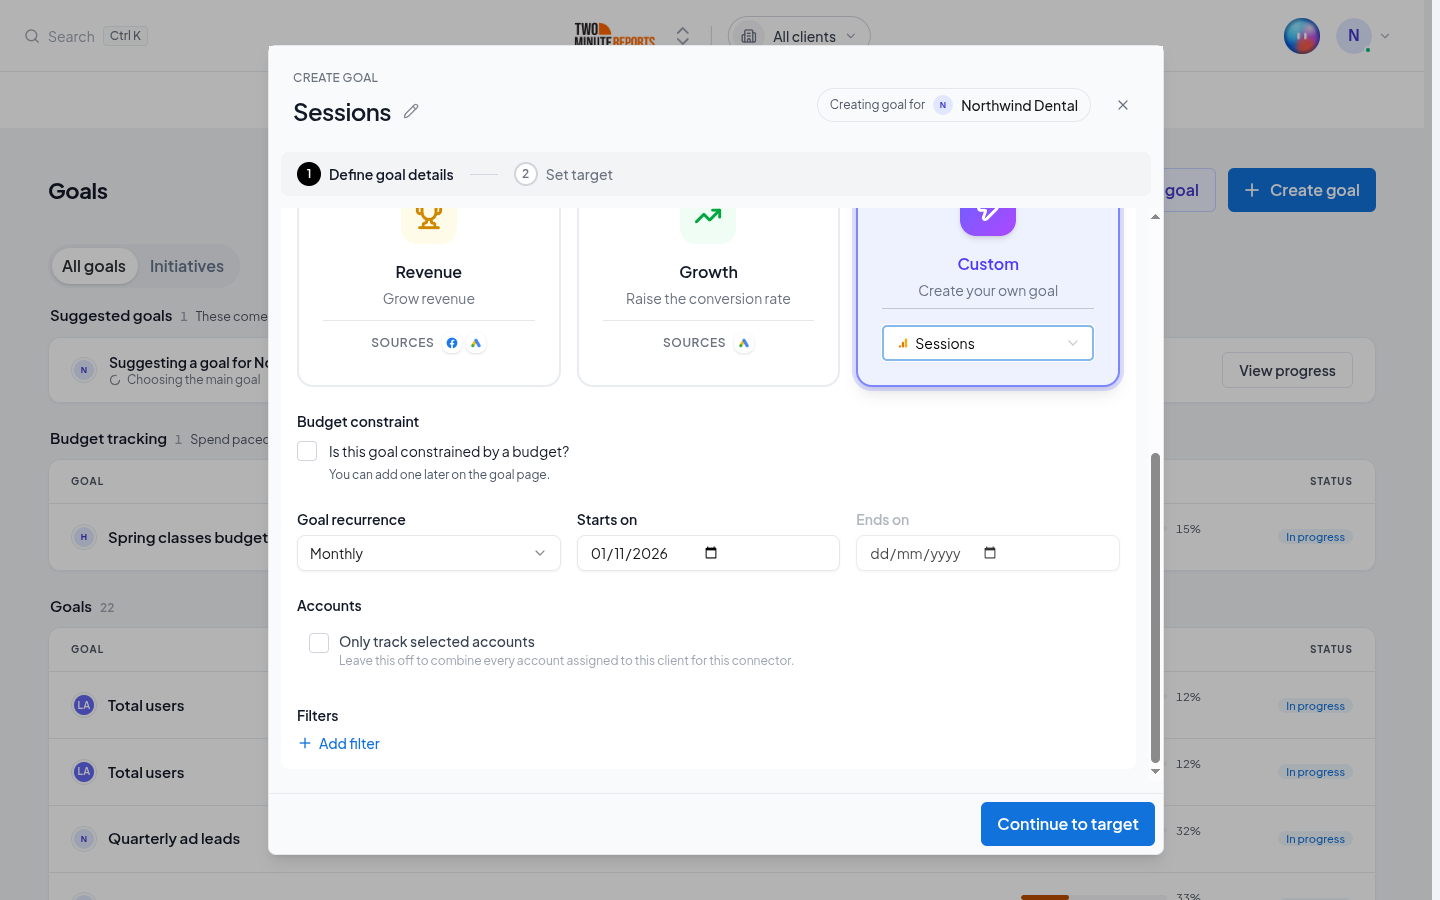
- Budget constraint (optional): select Is this goal constrained by a budget? to add a budget limit. You can also add a budget later on the goal page.
- Goal recurrence: Monthly, Quarterly, Yearly or One time. A recurring goal starts again at the start of each period.
- Starts on and Ends on: the dates of the goal. Ends on is optional.
- Accounts (optional): select Only track selected accounts to read only some of the client's accounts. When this is off, the goal adds up all the accounts that are assigned to the client for each connector.
- Filters (optional): select Add filter to count only some campaigns, for example.
Select Continue to target.
Step 4: Set the target
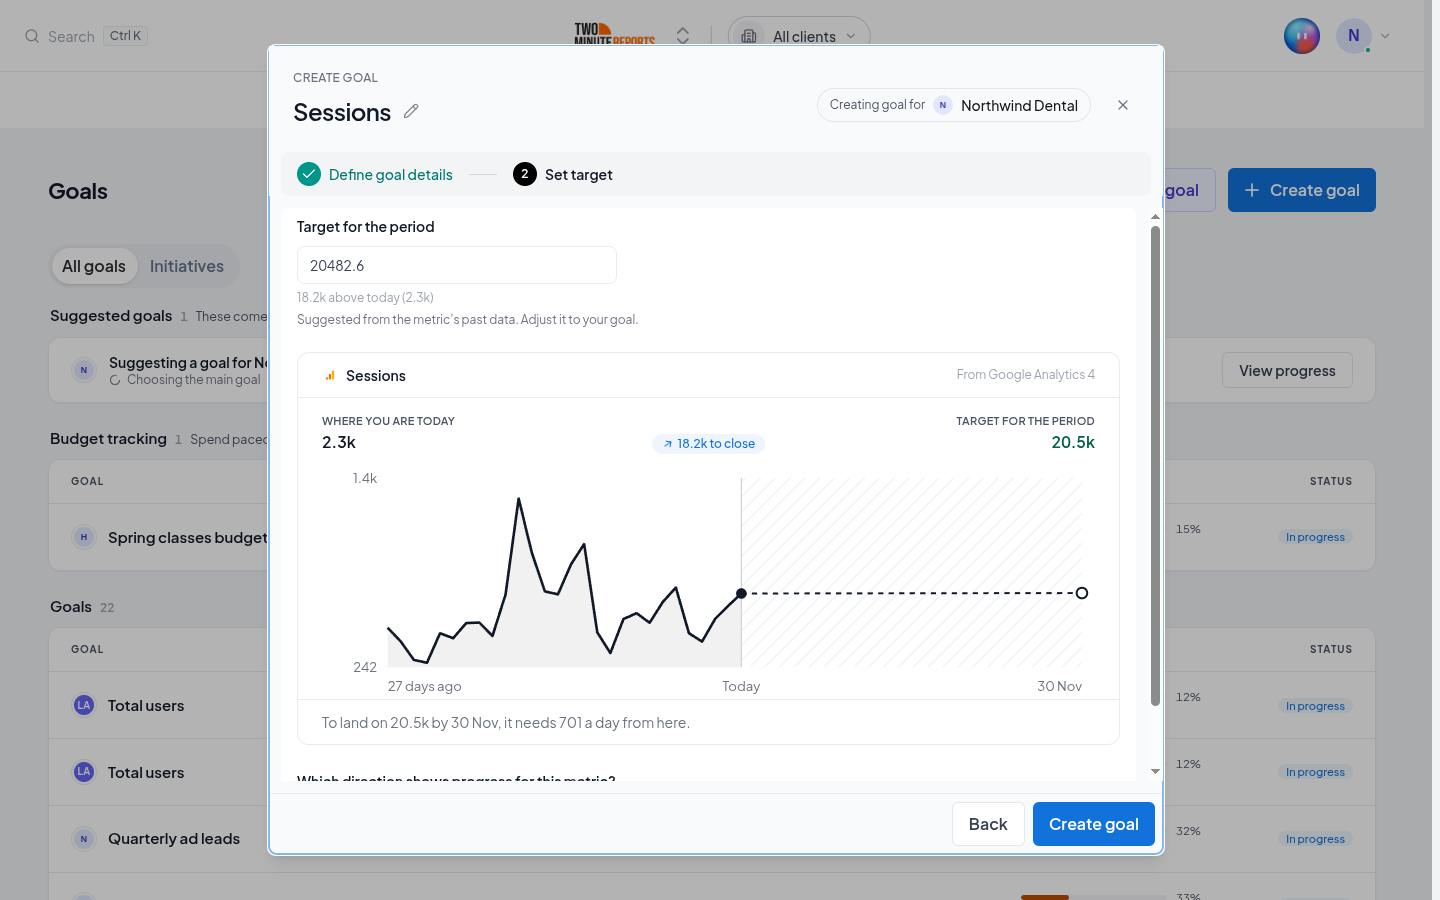
- In Target for the period, enter the target. Two Minute Reports suggests a target from the metric's past data. You can change it.
- Under Which direction shows progress for this metric?, select Higher is better or Lower is better. Conversions and revenue are higher is better. Cost per lead is lower is better.
- Select Create goal.
The chart shows the metric's recent values and the daily amount that the goal needs to reach the target.
Suggest a goal
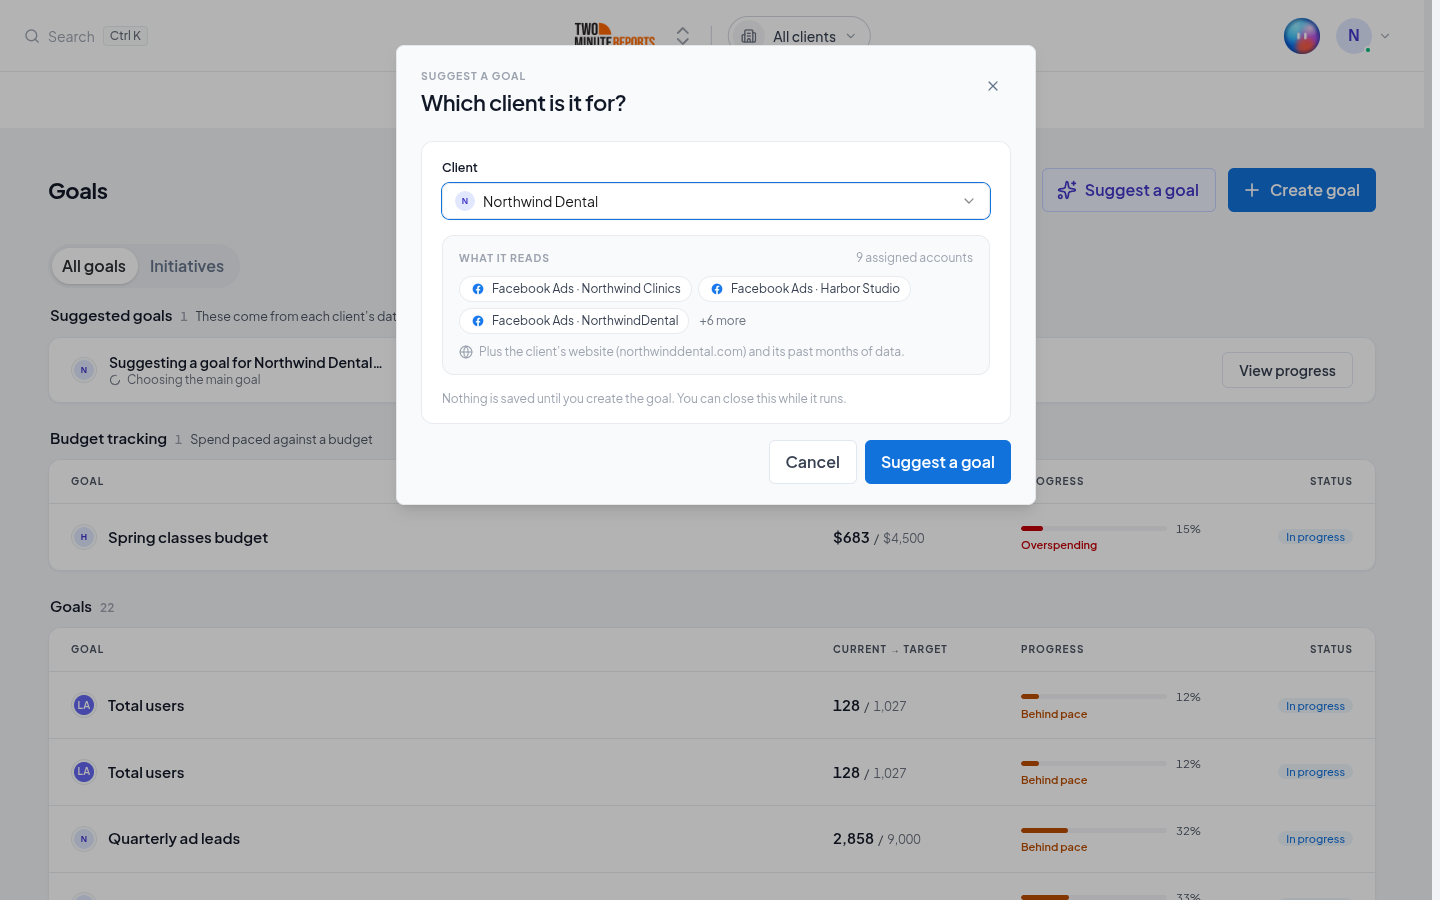
Two Minute Reports can suggest a goal for a client. A suggestion reads the client's assigned accounts, its website and its past months of data. It finds the main goal, the drivers under it, and a target for each card. Nothing is saved until you create the goal.
Step 1: Start the suggestion
- On the Goals page, select Suggest a goal.
- In Client, select the client. The dialog shows the accounts and the website that the suggestion reads.
- Select Suggest a goal.
Step 2: Wait for the suggestion
The dialog shows each step of the suggestion. A suggestion can take a few minutes.
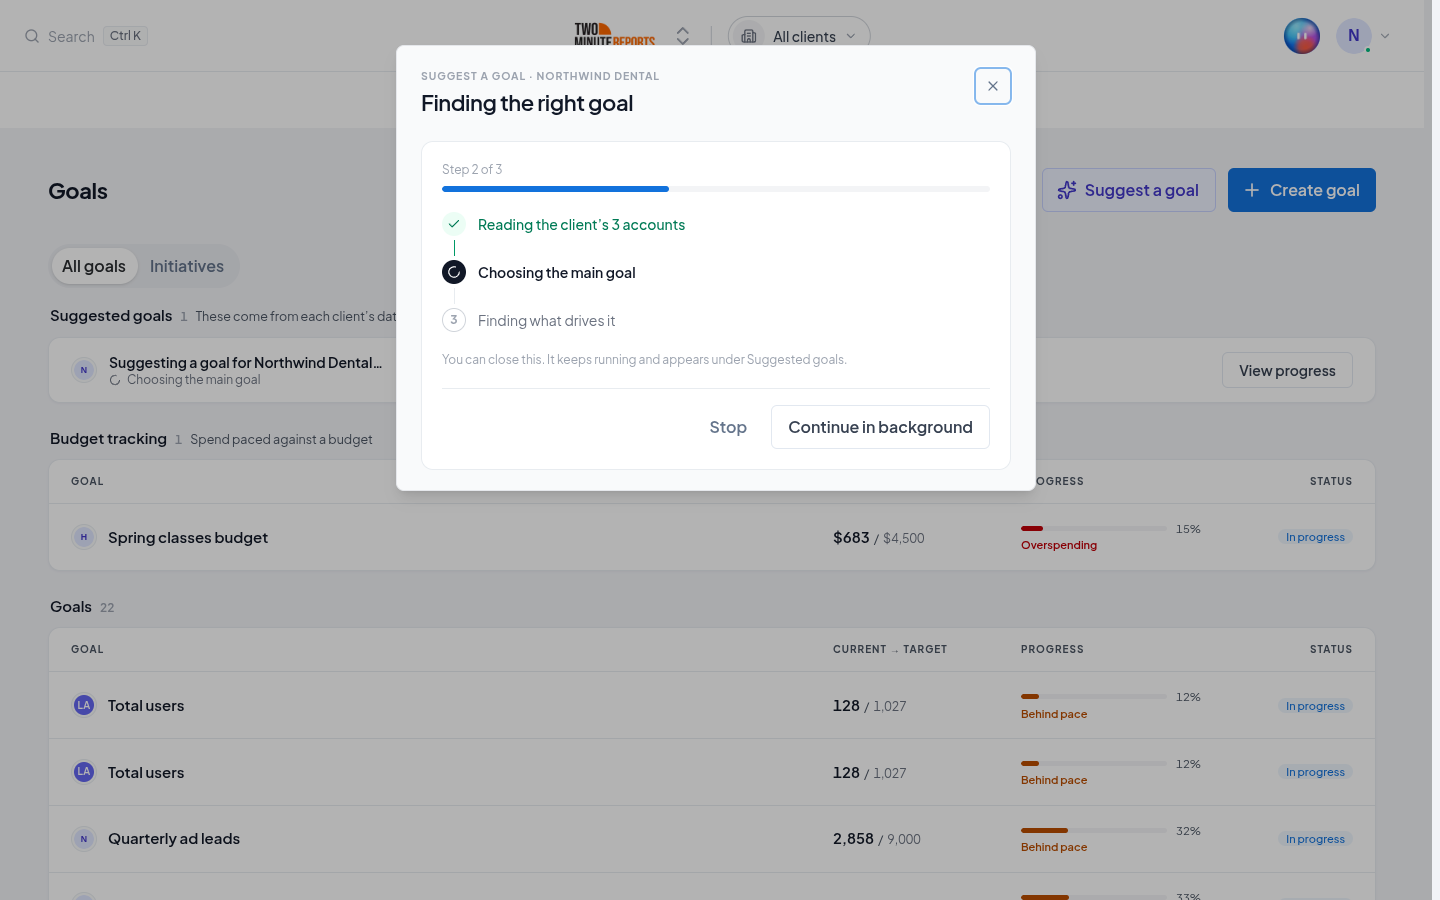
You do not have to wait. Select Continue in background to close the dialog. The suggestion continues, and it shows under Suggested goals on the Goals page. To end the suggestion, select Stop.
Step 3: Review the suggestion
When the suggestion is ready, select Review suggestion. You can also select Review next to the suggestion on the Goals page.
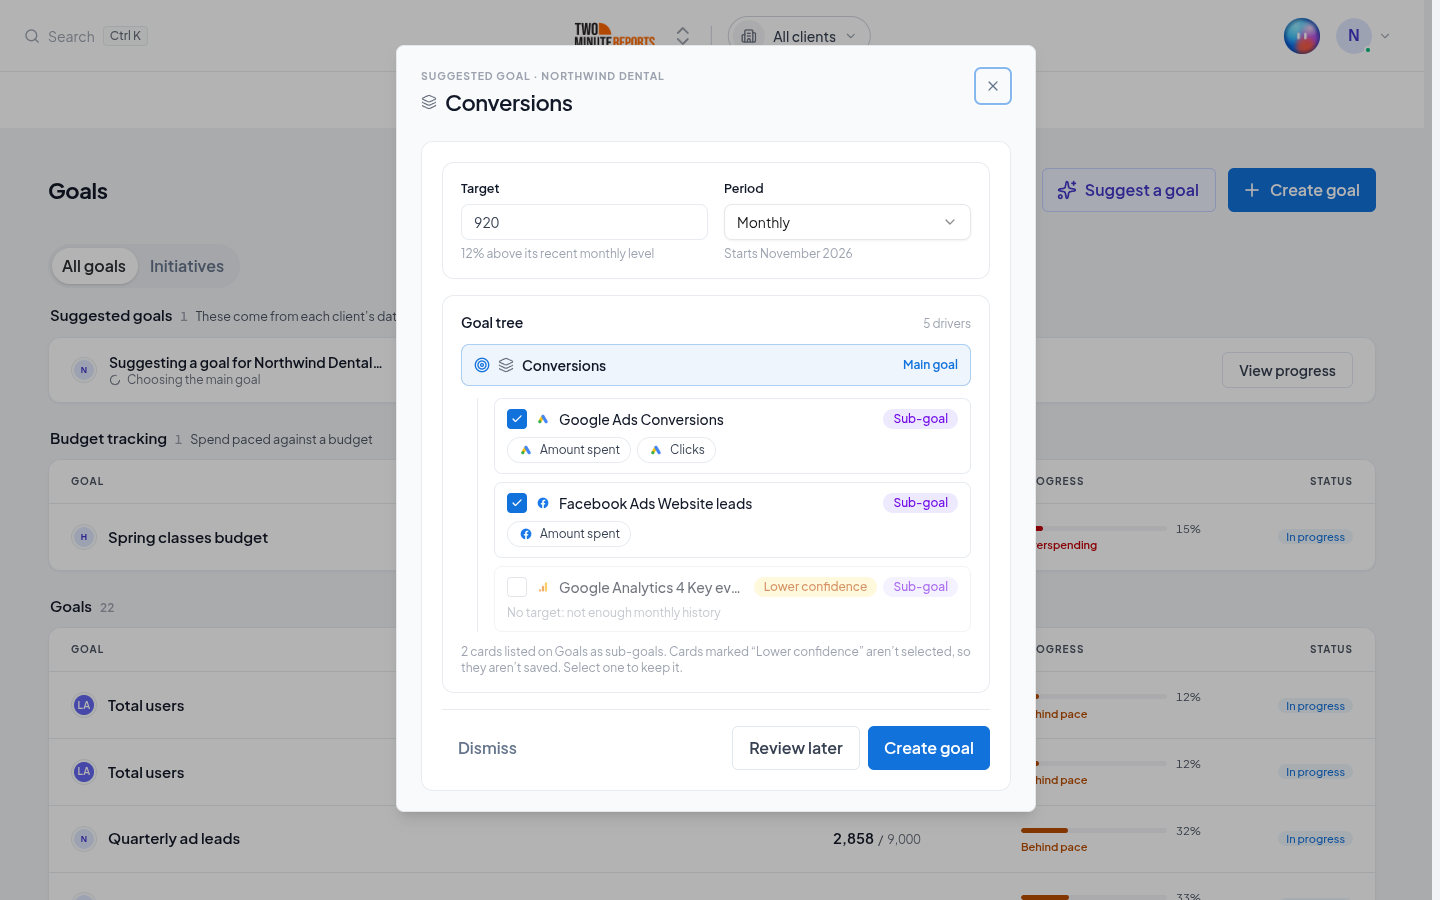
- Check the Target. You can change it.
- Select the Period: Monthly, Quarterly or Yearly. A new period gets its own suggested target.
- Under Goal tree, select the cards to keep. A card with Lower confidence is not selected. A card that is not selected is not saved, and its drivers are not saved.
- Select Create goal.
To decide later, select Review later. To remove the suggestion, select Dismiss.
Your team can start 10 suggestions in one hour. After that, Two Minute Reports shows how many minutes to wait.
The goal page
The goal page shows the goal's progress and its goal tree. The menu on the left opens each section.
Goal tree
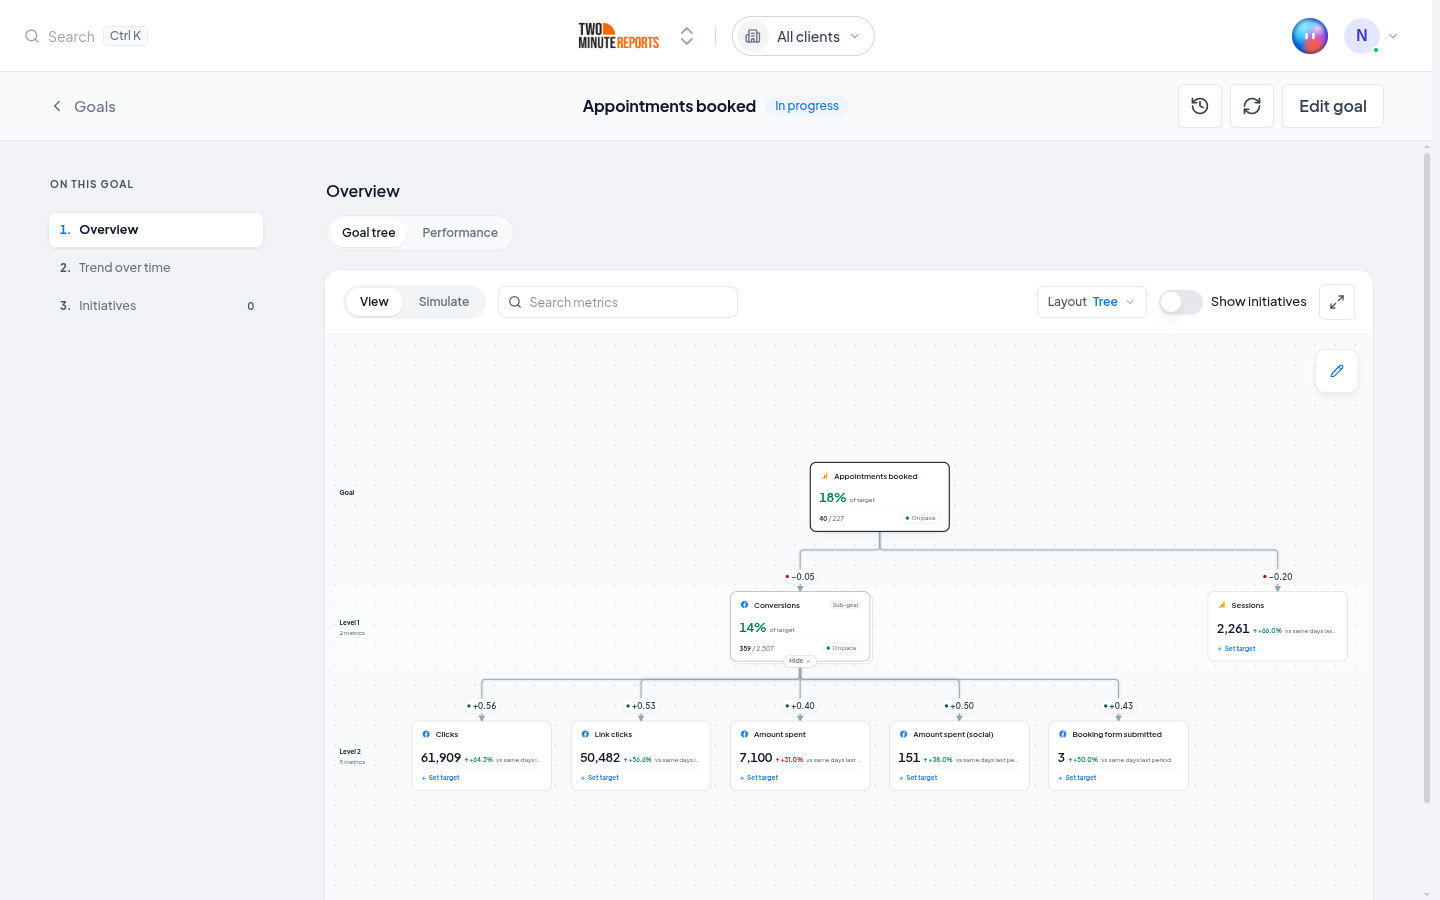
The goal is at the top of the tree. The cards below it are drivers: metrics that move the goal. A driver with its own target is a Sub-goal. A sub-goal also shows on the Goals page.
Each card shows the metric's value and its progress. The number on each link shows how closely the card moves with the card above it, from -1 to 1. A number near 1 means that they rise and fall together.
To change the tree, select the pencil icon.
Performance
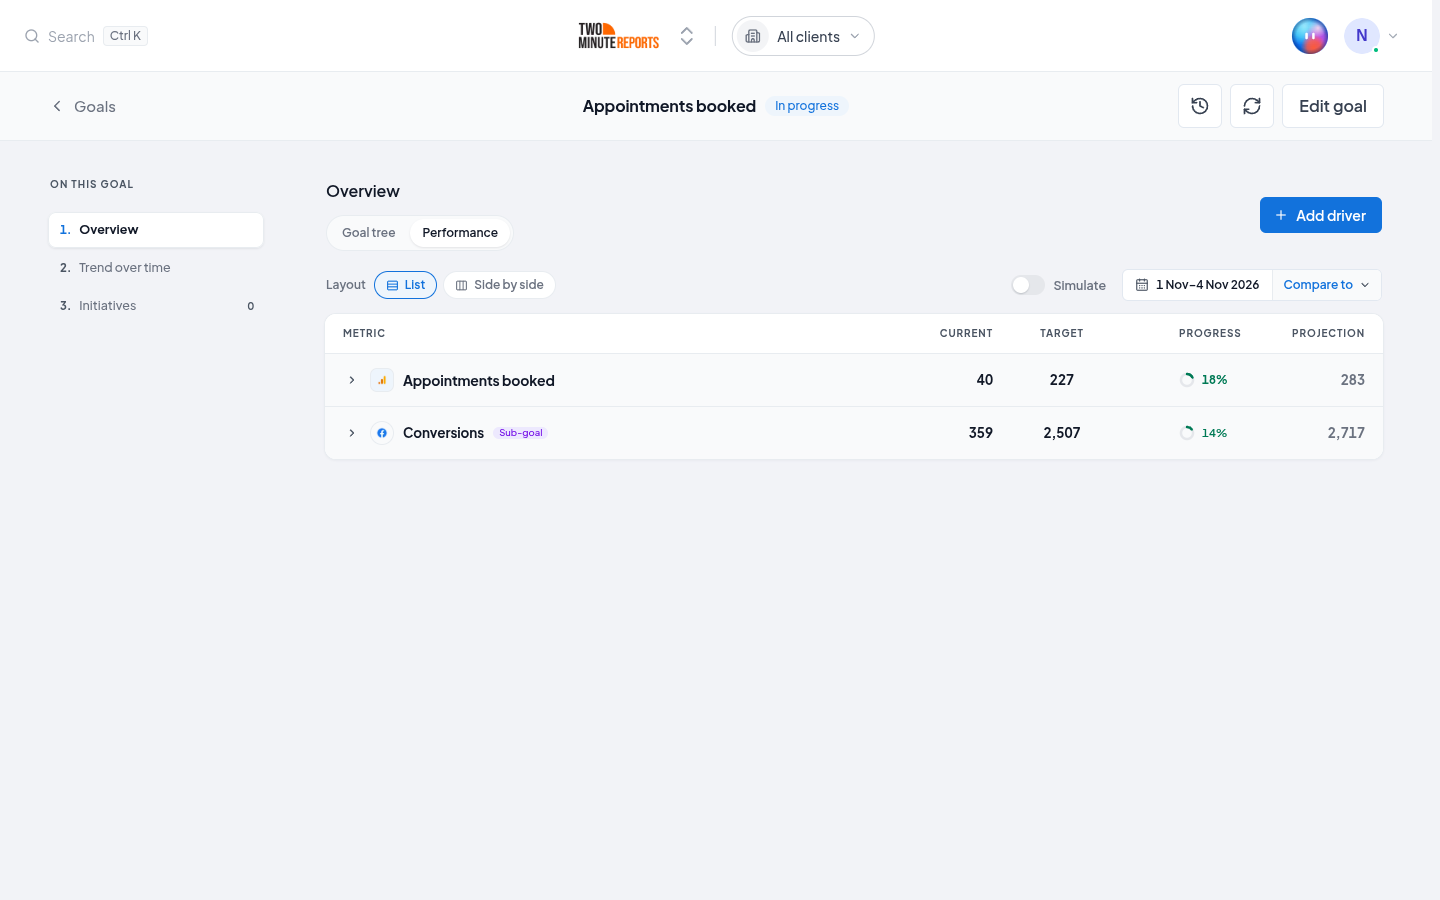
Performance shows the goal and its sub-goals in a list. Each row shows the current value, the target, the progress and the projection. The projection is the value at the end of the period if the current pace continues. To add a metric to the tree, select Add driver.
Trend over time
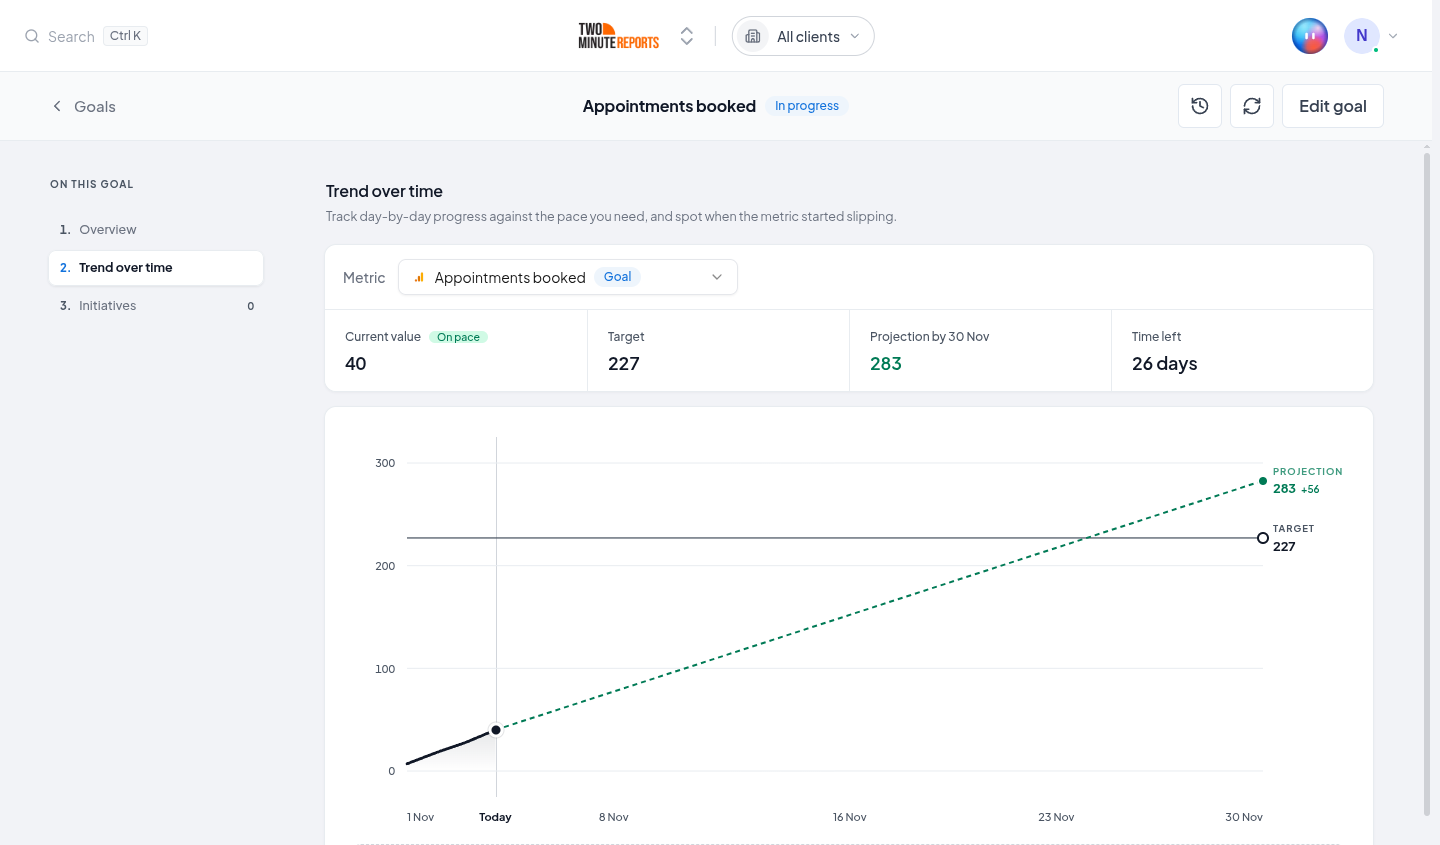
Trend over time shows the metric day by day, the target, and the projection to the end of the period. To see a driver or a sub-goal, select it in Metric.
Simulate
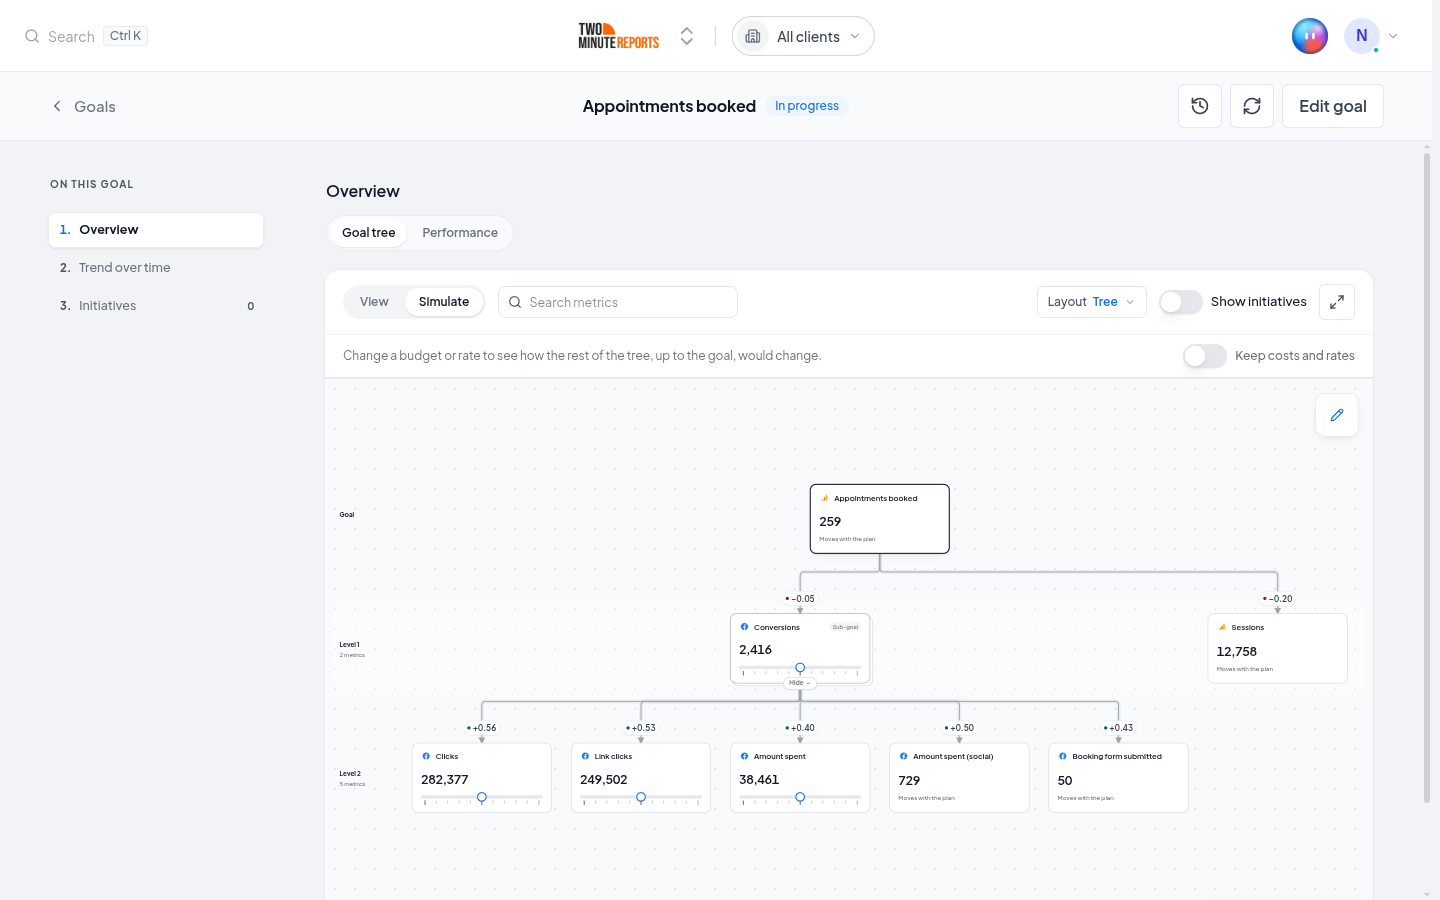
In the goal tree, select Simulate. Move the slider on a budget or rate card, such as the amount spent. The rest of the tree changes, up to the goal. Simulate learns from the goal's past data, so the result is an estimate.
To go back to the values, select View.
Goal status
Each goal shows two labels.
The first label is the progress for the period:
- Ahead of pace: the projection is at least 10% above the target.
- On pace: the projection reaches the target.
- Behind pace: the projection is below the target.
- Under ceiling and Over ceiling: for a goal where lower is better, the projection is below or above the target.
The second label shows where the goal is in its period: Not started, In progress, Achieved or Ended. A goal without a target shows No target.
Budgets
A budget sets a limit on ad spend for a period. To add a budget, select Is this goal constrained by a budget? when you create the goal. Then set the Budget limit, the Budget recurrence and the start date.
A goal that tracks spend against its budget shows under Budget tracking on the Goals page. Its goal page shows Budget pacing.
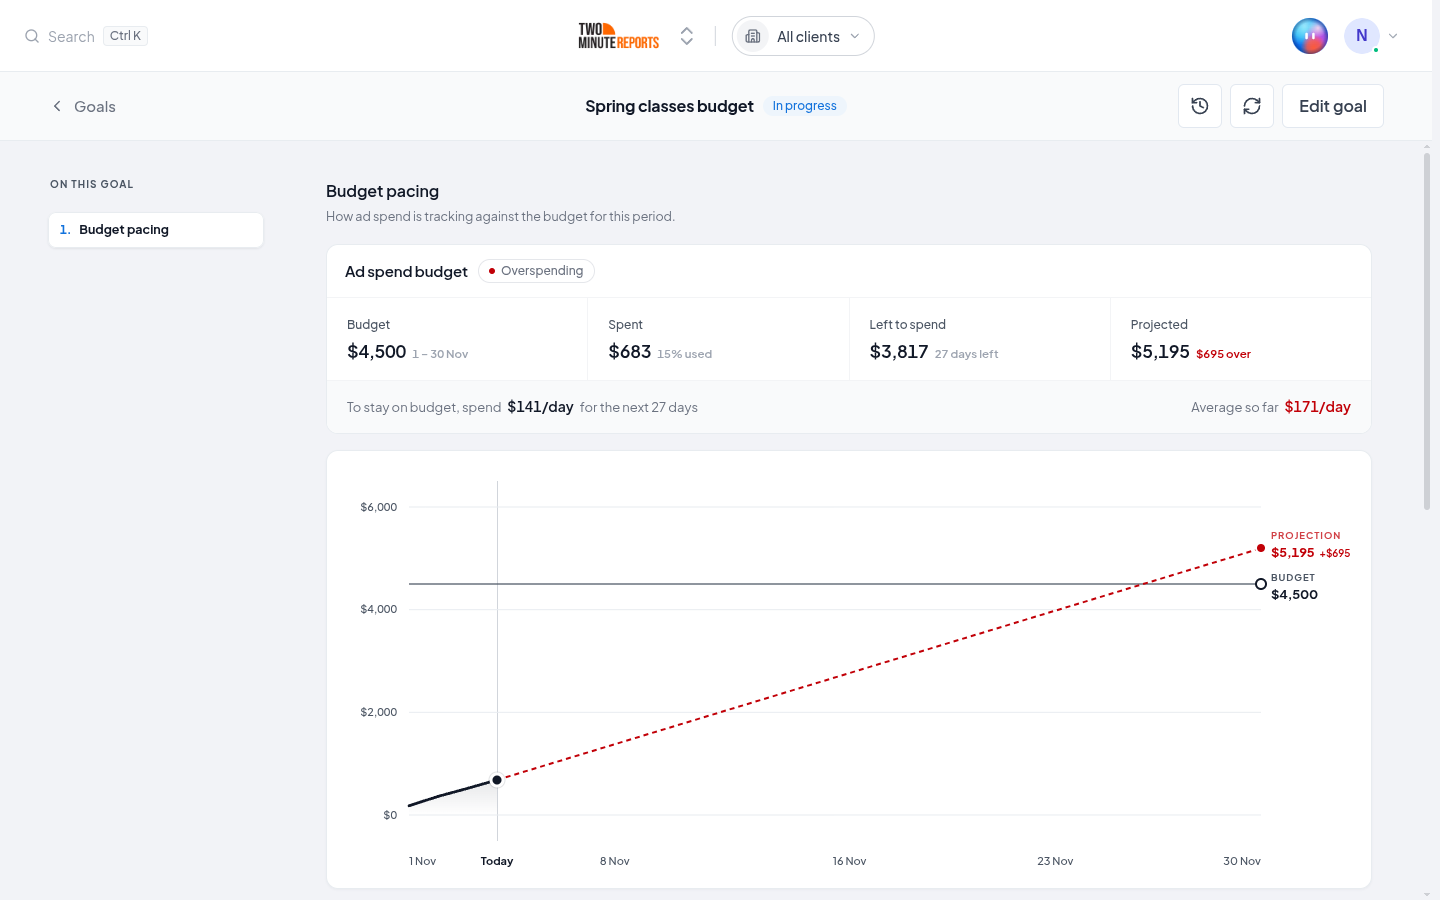
Budget pacing shows:
- Budget: the limit for the period.
- Spent: the spend until today.
- Left to spend: the amount left, and the days left.
- Projected: the spend at the end of the period if the current pace continues.
- The daily spend that keeps the budget on pace for the rest of the period.
The budget status is On pace when the spend is within 5% of an even daily spend. It is Underspending below that, and Overspending above that.
Errors and data availability
If Two Minute Reports cannot read a goal's data, the goal shows a message that tells what went wrong. Common causes:
- The connection needs reconnecting.
- The goal's accounts or metric are no longer available.
- A temporary delay from the platform.
Check the status of your connections. See Troubleshooting for more help.
Frequently asked questions
Can I set different goals for different clients? Yes. Each goal is for one client. Create the goals that each client cares about.
What is the difference between a driver and a sub-goal? A driver is a metric in the goal tree that moves the goal. A sub-goal is a driver with its own target. Sub-goals also show on the Goals page.
Does a suggestion change my goals? No. Nothing is saved until you select Create goal in the review.
How often does a goal start again? A recurring goal starts again at the start of each month, quarter or year. Set Ends on to stop the goal on a date.
What happens if a connection needs reconnecting? The goal shows an error until you reconnect the connection. No data is lost.
Next steps
- Manage clients - Organize clients and assign accounts to them
- Browse connectors - Connect the platforms that feed your goals
- Getting started - New to Two Minute Reports? Start here
Migrate existing reports
Recreate an existing Google Sheets or Google Data Studio report as a Two Minute Reports dashboard by uploading its PDF or a screenshot.
Custom fields
Create your own metrics and dimensions, from formulas and conditional rules to blending fields across connectors and splitting text, and reuse them across dashboards and goals.